I see, sry misunderstood, then diff parts and whole brain, all neuropils and neuron names id see as something useful, maybe diff orientations but not sure on that one.
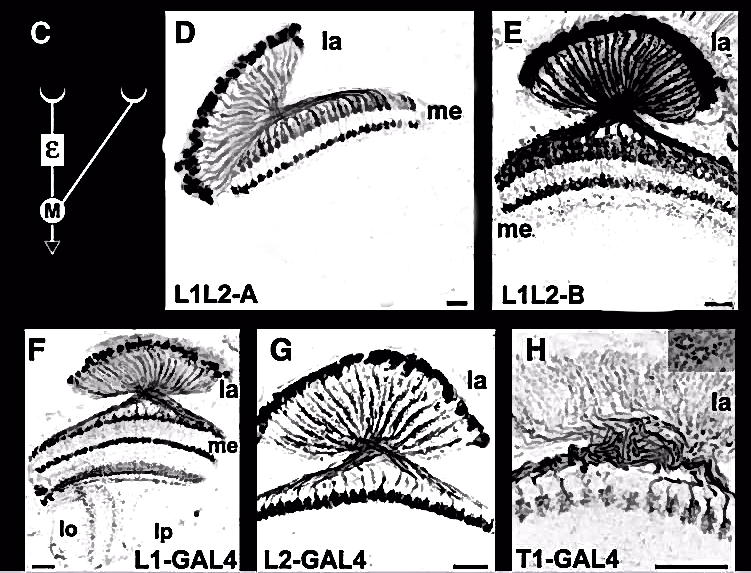
Attempted an inversion and clean up of the image from this 2007 paper in hopes of improving visual contrast and acuity.
L1L2-A, L1L2-B, L1-GAL4, L2-GAL4, T1-GAL4
4 Likes
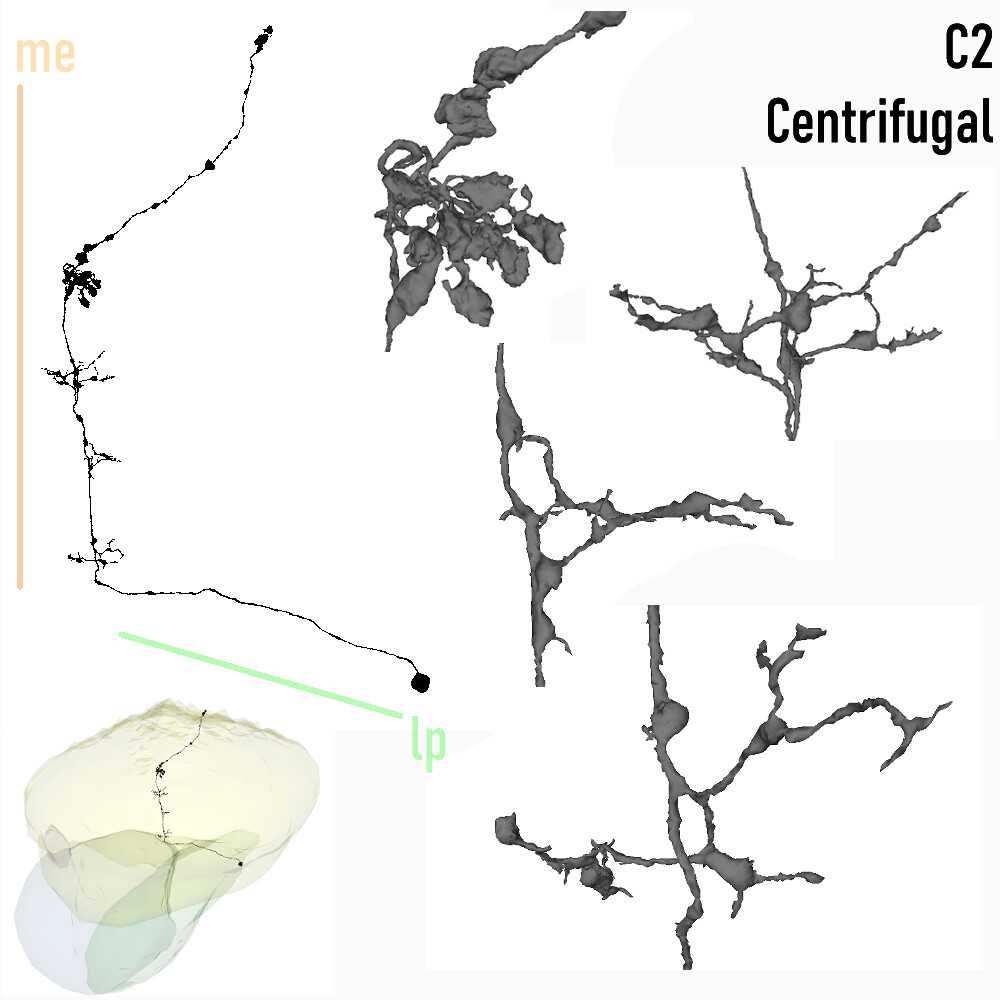
Attempting a new type of illustration with an emphasis on the silhouette ala Fischbach, highlighting cluster shapes and optic lobe locations. Should I continue with these?
Edit: v2 with edits suggested by annkri -
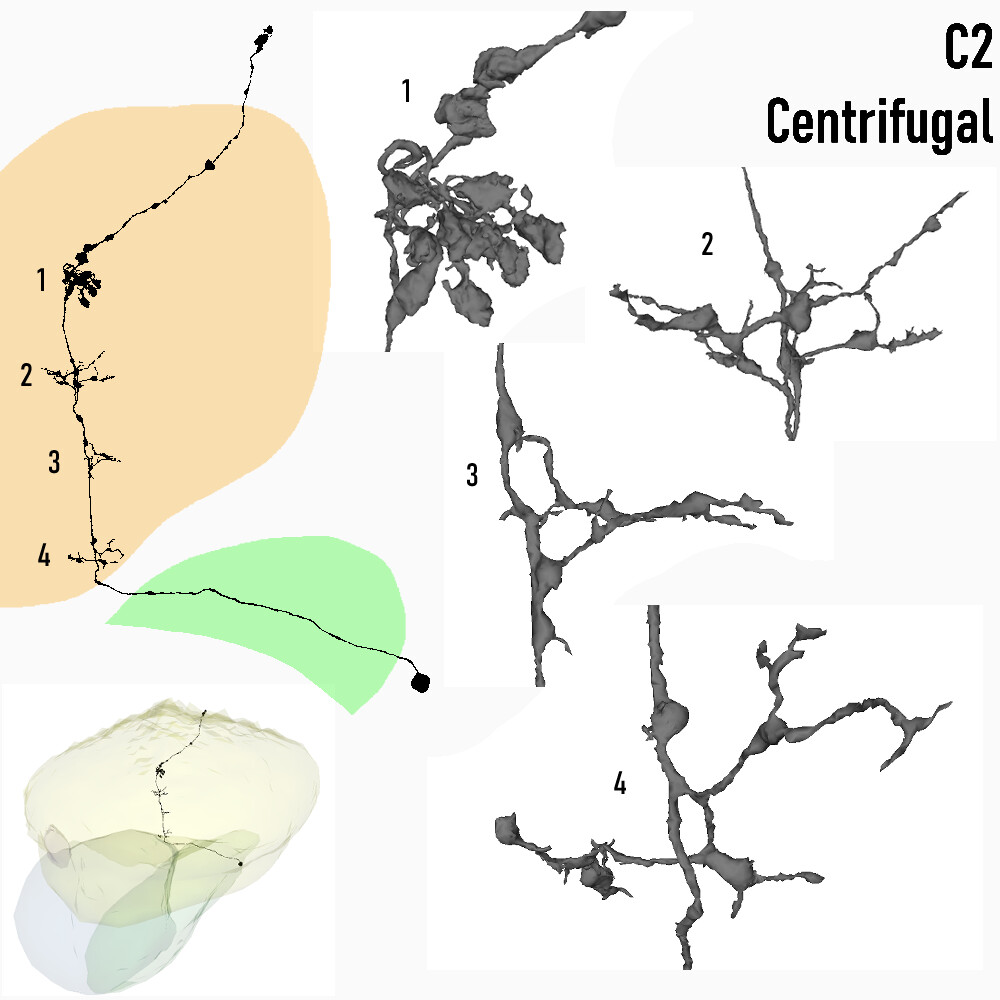
Centrifugal, C2
6 Likes
@AzureJay Yes, absolutely…all visualizations are helpful! It would also be beneficial to identify the cells in the text of the post, so that the post will be discoverable using the search tool, in the discussion board.
A list of keywords would work…for example,
Keywords: Centrifugal, C2
Nice visuals too, btw! ![]()
![]()
Cheers.
3 Likes
Keywords added for each image ![]()
3 Likes
I found examples of Li11 - Li19 on neuPrintExplorer
You need to login with your Google Account to see the 3D renderings.
On the same site you can find more examples of the cells below (and of many others, ofc).
Unfortunately for us, they’ve focused on hemibrain, so not many cells from the Optic Lobe. They only have almost whole Lobula and some small parts of Medulla and Lobula Plate:

The 2 blobs at the top are parts of Medulla, the one at the bottom is LP, and the rest is Lobula.
Here is their whole dataset:

I didn’t find there any of Li1 - Li10.
On all the images below I’ve added the fragments of Medulla (top) and LP (bottom) for easier orientation.
Li11:

Li12:

Li13:

Li14:
Li15:
Li16:
Li17: (this one has a big branch cut away, so be careful with identification)
Li18:
Li19:
I’ve also found there: Lt(1, 11, 33-38), Lpt(3, 4, 7, 8, 9) - they call them IVLPT, LPLC (1, 2, 4).
Keywords: Li11, Li12, Li13, Li14, Li15, Li16, Li17, Li18, Li19, Li20, Li21, Li22, Lt1, Lt11, Lt33, Lt34, Lt35, Lt36, Lt37, Lt38, Lpt3, Lpt4, Lpt7, Lpt8, Lpt9, LPLC1, LPLC2, LPLC4, lobula, lobula intrinsic, jamelia, neuprint
Edit: There are also over 30 000 cells identified that have input or outputs in Lobula (may take a while to load) - click the eye icon to view the skeleton:
Edit2: They have their dataset available in Neuroglancer, but it’s a different dataset from FAFB (as far, as I can tell), so the coords doesn’t much.
Their Neuroglancer:
4 Likes
That looks more like dm cells than the same L cells we have from fishback, could ofc be a case of different naming?
3 Likes
The difference is, that Dm cells have their arborization completely inside Medulla and soma between Medulla and Lamina, while Li cells have arborization in Lobula and CB somewhere deeper in the brain.
And yes, these are all Li cells, not L cells. I’ve made a mistake and I’ll fix it very soon.
2 Likes
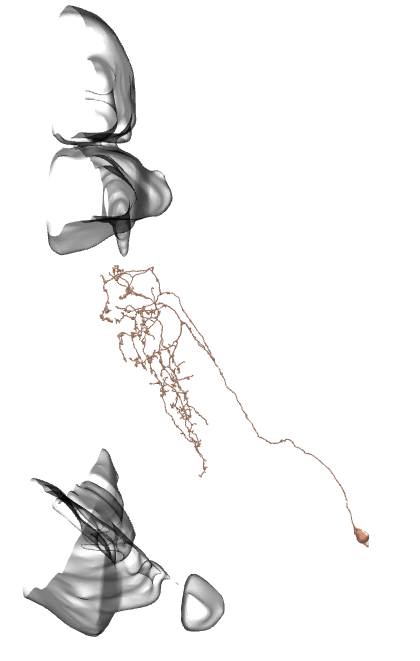
Keywords: L3, Dm1, Dm4, Dm12
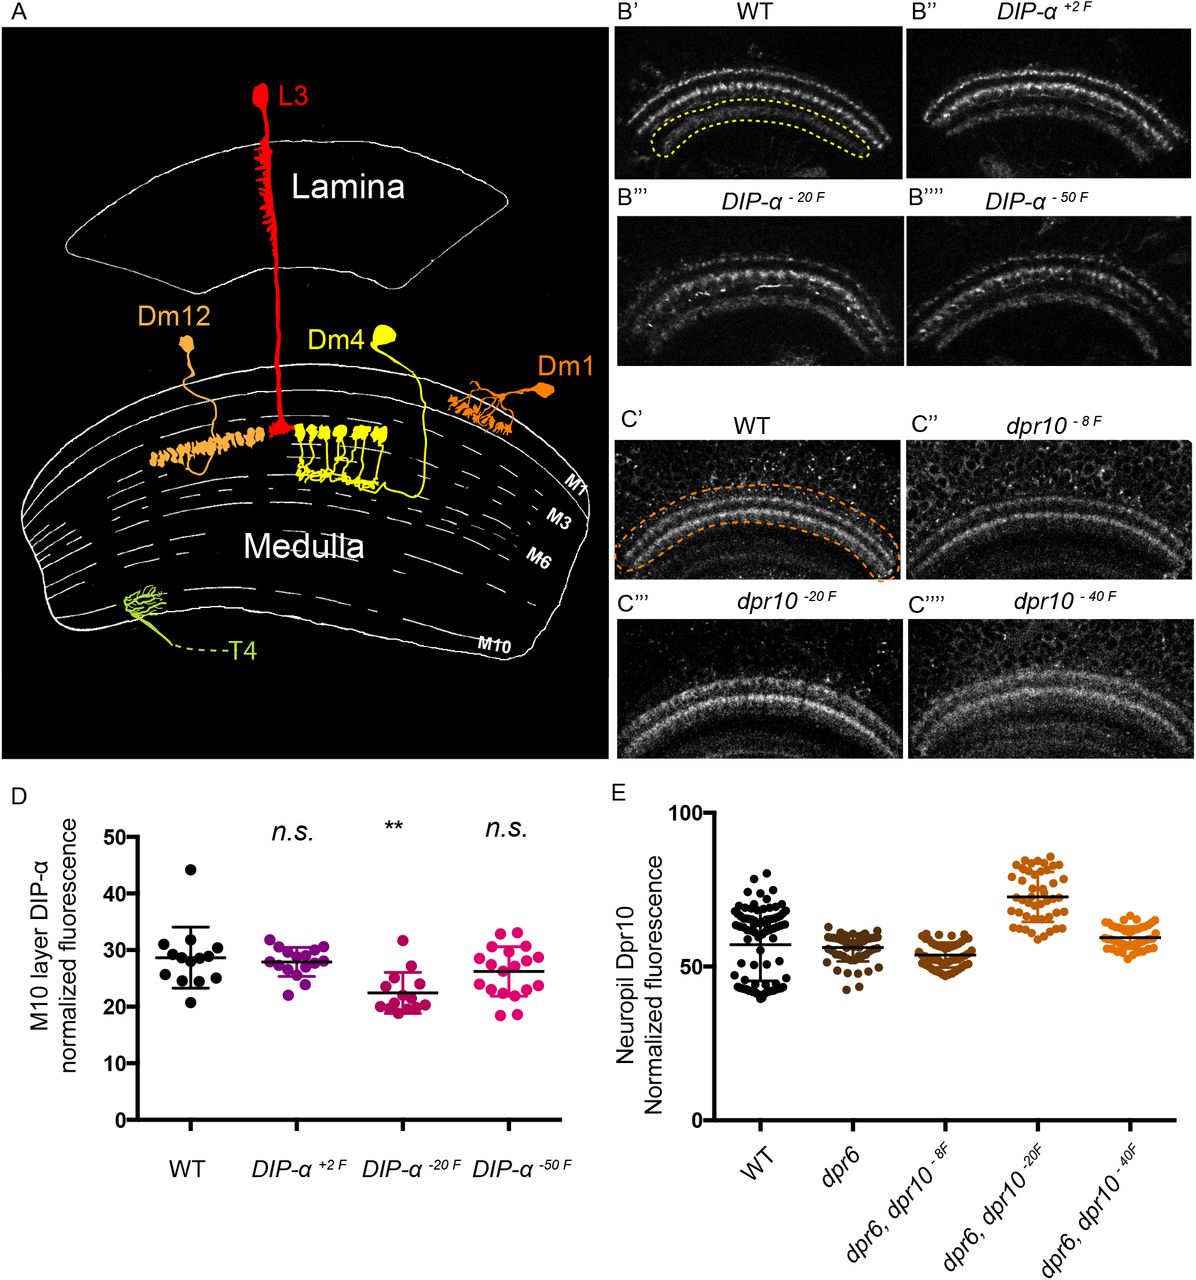
What’s interesting in this picture is, that it shows Dm4 completely different than the Fischbach’s paper.
Other pictures in the Internet also show the Dm4 in the way, like the picture above:
So it looks, like the consensus amongst scientists is, that Fischbach’s Dm4 is wrong.
3 Likes
The Dm4 in Fischbach seems to only have one or two ‘clusters’ drawn, but the backbone structure, branch-twistiness, and location all look otherwise consistent to me. Maybe the full set of 20+ ‘clusters’ were omitted for “image clarity”? (Admittedly its the first time I’ve actually looked at the DmX section from Fischbach, I’ve relied on the images in this thread more for them)
3 Likes
Yes, the overall structure looks quite similar. The lack of the clusters confuses me. The clusters look like a defining feature of this type of cell.
Also, the one in Fischbach has mach wider arborization, that on the other drawings.
3 Likes
i have always looked at the Dm4 in fishback as someone having drawn it by hand, but not beeing able to adequatly represent the flower structure of a Dm4 so just making a crusedule instead.
5 Likes
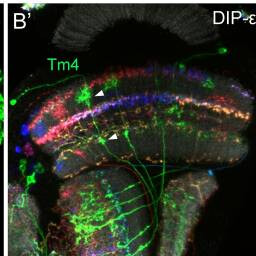
Tm4
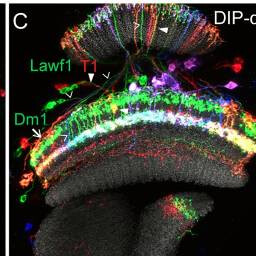
Lawf1, T1, Dm1
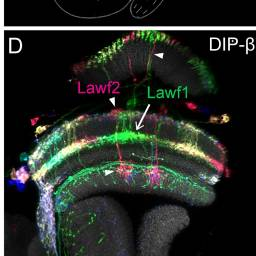
Lawf1, Lawf2
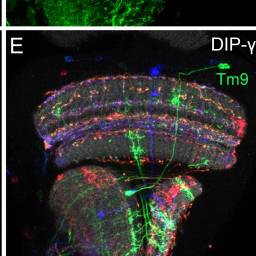
Tm9
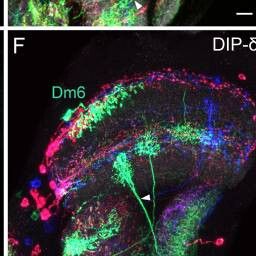
Dm6, Y3
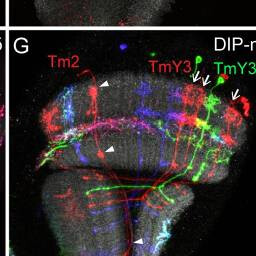
Tm2, TmY3
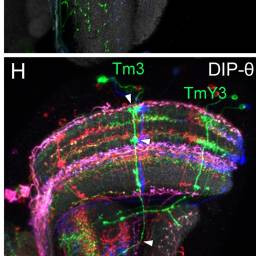
Tm3, TmY3
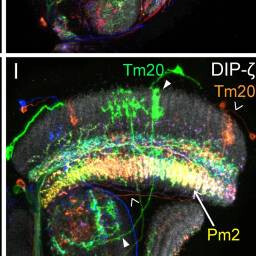
Tm20, Pm2
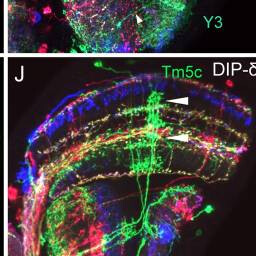
Tm5c
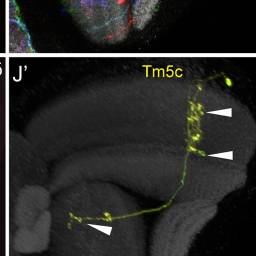
Tm5c
4 Likes
Note: I generally am avoiding any larval stage images to avoid confusion but sometimes they offer some interesting information. If this interests you I recommend Spatio-temporal pattern of neuronal differentiation in the Drosophila visual system: A user’s guide to the dynamic morphology of the developing optic lobe
Kathy T. Ngo, Ingrid Andrade, and Volker Hartenstein
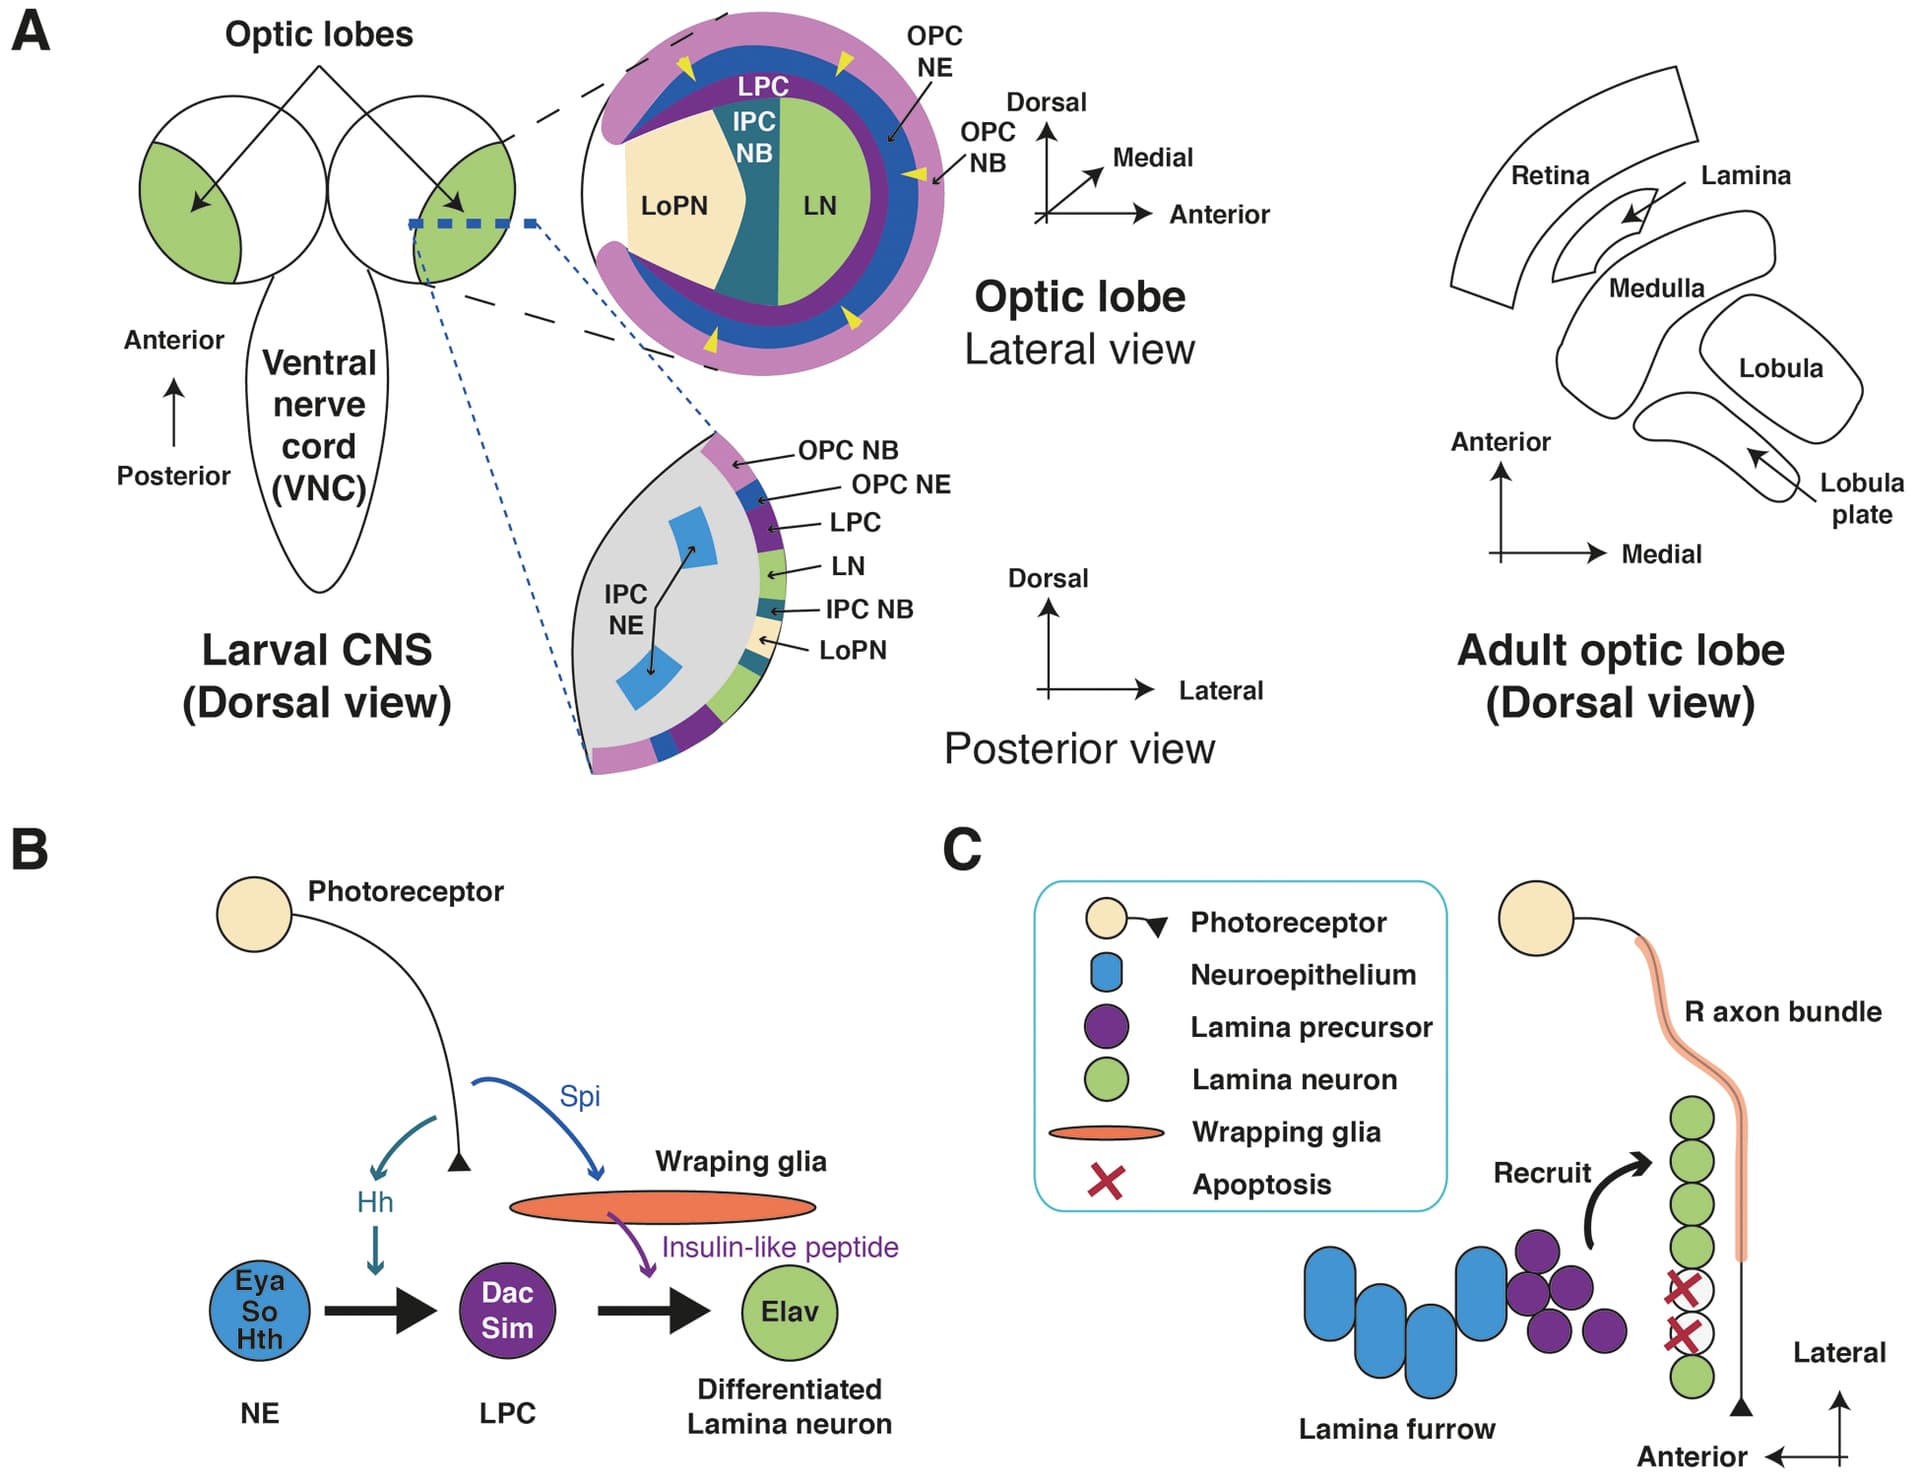
Keywords: Optic lobe, Larval, Adult, Photoreceptor, Connectome, Lamina, Glia
4 Likes
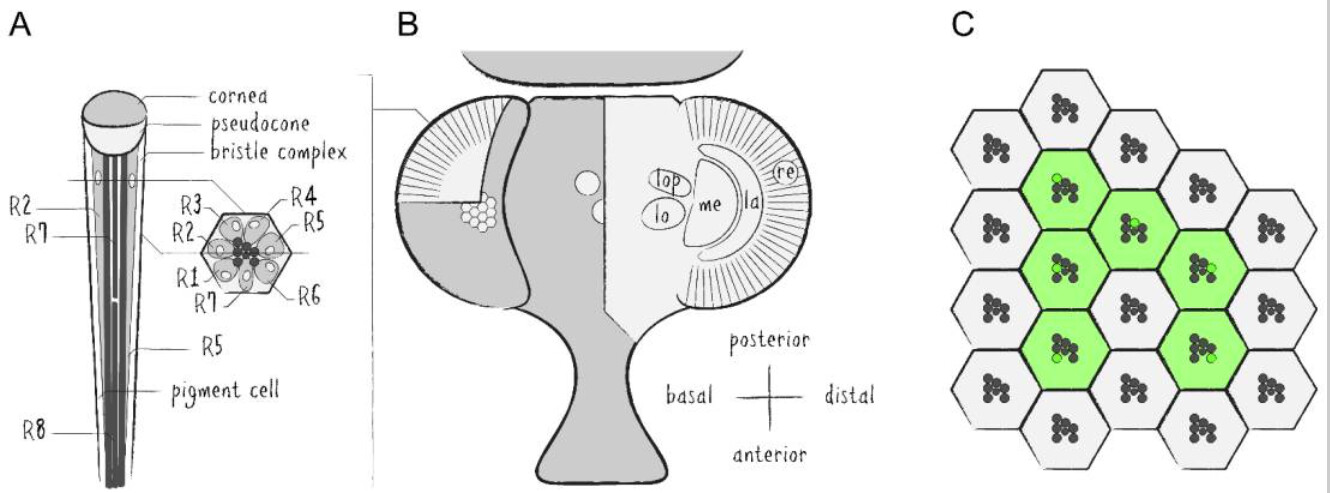
Schematics of the Drosophila visual system. (A ) Illustration of a longitudinal section through the ommatidial center (left side) and a cross section through the plane just below the pseudocone, where the nuclei (white) of the photoreceptor cells (PRCs) R1–7 (light grey) are located (right side). Trapezoidal layout of the outer PRCs’ rhabdomeres in the center of the ommatidium is indicated (dark grey). Primary and secondary pigment cells not drawn. (B ) Top view of a partially cross sectioned Drosophila head to illustrate the organization of the ommatidia (left side) and the optic lobe (right side). Indication of the hexagonal tiling by individual corneas on the curved surface of the compound eye and partial cross section to illustrate the wedged shape of ommatidial units. Order of neuropils from distal to basal: retina (re), lamina (la), medulla (me), lobula (lo) and lobula plate (lop). (C ) Illustration of the repetitive organization and identical orientation of ommatidia and PRCs in a top view of a section of the compound eye. Origin of the pseudopupil phenomenon is indicated by highlighting the fluorescence of individual rhabdomeres from adjacent ommatidia (green) which together generate the fluorescent ommatidial trapezoid when rhabdomeral FPs are expressed in R1–6.
Source: Application of Fluorescent Proteins for Functional Dissection of the Drosophila Visual System - PMC
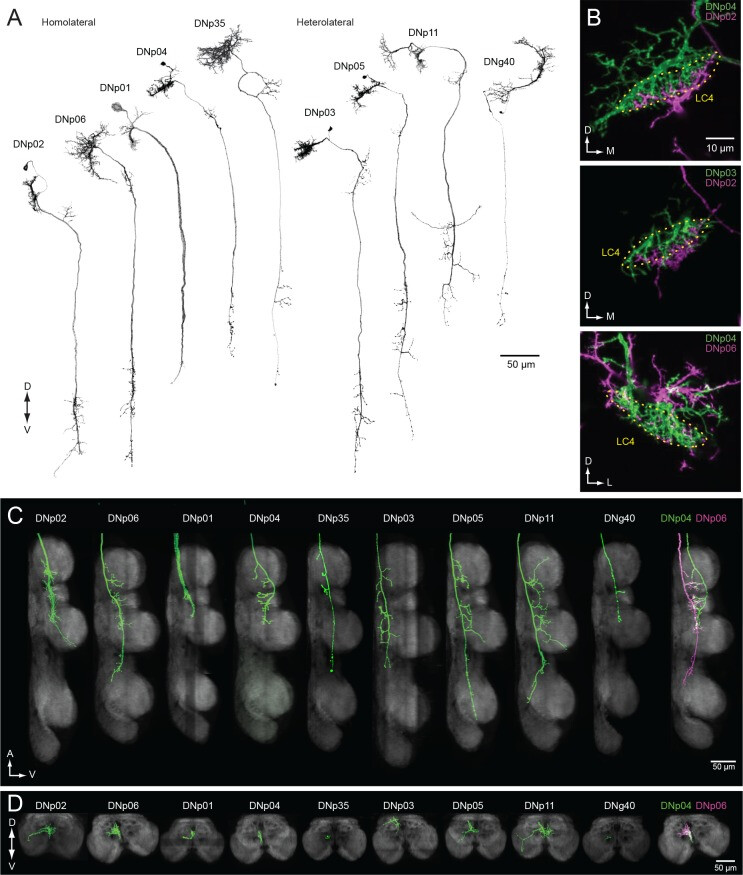
DNs forming a dendritic cluster within the LC4 glomerulus project to the lower tectulum.
(A) The morphologies of DNs which have dendritic innervation to the LC4 glomerulus (‘LC4 DNs’). The maximum intensity projection of a confocal stack with 20x objective are shown. All DNs partially share input (LC4 glomeruli) and most of them have axonal projection into the lower tectulum. These DNs are comparable to the ‘descending neuron cluster’ reported in blowflies (Milde and Strausfeld, 1990). (B) Simultaneous labeling of two different DNs innervating the LC4 glomerulus, visualized using multicolor flip out (see Materials and methods). Three examples are shown. The shape of the LC4 glomerulus is shown with a dotted line. (C) Sagittal view of LC4 DN axonal projections within the VNC. All but one (8/9) have axon terminals in the lower tectulum region of the VNC. One DN does not innervate this region (DNp03). An example of simultaneous labeling of 2 DNs is shown (DNp04 and p06, right). (D) Frontal view of LC4 DN projections in the mesothoracic neuropil. Projections are focused in the central region of the VNC volume, in the lower tectulum layer.
Source: The functional organization of descending sensory-motor pathways in Drosophila - PMC
Note: This source has a lot of great illustrations of the DNs (descending neurons); however we will likely not be encountering/working with them often. I chose this particular image since it interacted with LC4 and other LPLC neurons.
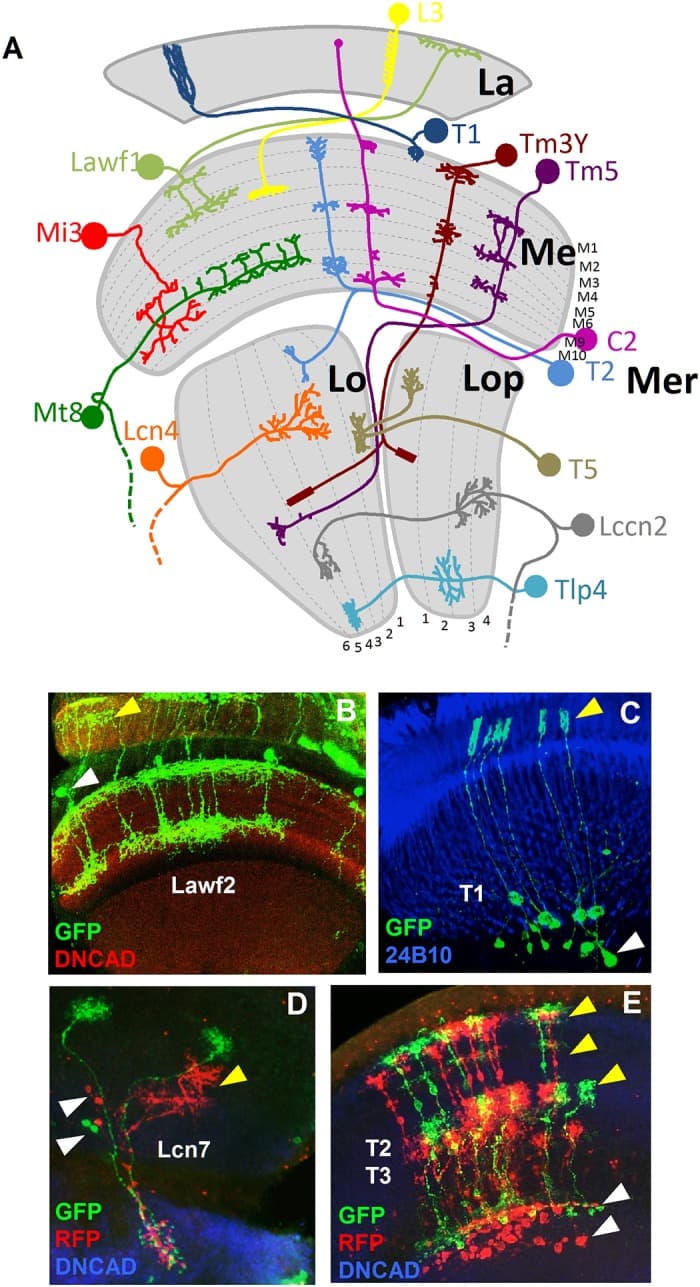
(A) Model showing a sample of neuron types in the optic lobe. The neuropils of the OL and the layers of each neuropil are shown in grey. La: lamina. Me: medulla. Lo: lobula. Lop: lobula plate. Mer: medulla rim. (B) Lawf2 neurons homogeneous MARCM clone. Arrowheads indicate projections in the lamina (yellow) and cell bodies in the medulla cortex (white). Projections reach M1 and M9 of the medulla neuropil (labeled with DN-cadherin in red). (C) T1 homogeneous MARCM clone. Arrowheads indicate projection in the lamina (yellow), cell bodies in the medulla cortex (white). (D) Lcn7 neurons homogeneous twin spot MARCM clone. Cell bodies (white arrowheads) and projections (yellow arrowheads) remain in the lobula. (E) T2-T3 neurons homogeneous twin spot MARCM clone. Projections are in the medulla (white arrowhead) and lobula (yellow arrowhead). (Neuropils in D and E stained in blue with DN-cadherin).
Samples summarizing the types of clones.
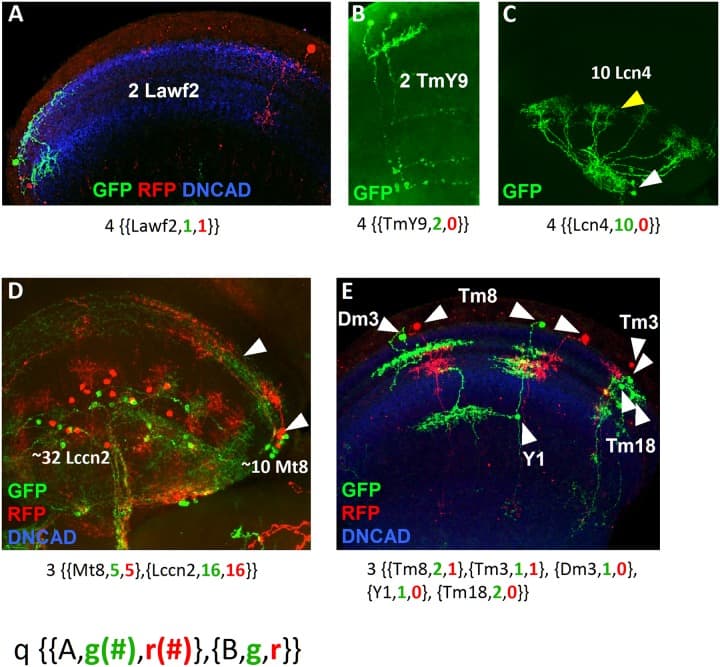
(A) Sister cell clones of Lawf2 labeled with GFP and RFP projecting in the medulla neuropil (blue). (B) Sister cell clone of TmY9 neurons labeled by GFP projecting in the medulla and the lobula neuropils. (C) Homogeneous clone of 10 Lcn4 lobula neurons, with cell bodies (white arrowheads) and projections (yellow arrowheads) in the lobula. (D) Cell clone showing two different neuron types: the lobula Lccn2 and the medulla Mt8 (white arrowheads point cell bodies in the medulla rim and projections in the medulla), both labeled by GFP and RFP. (E) Cell clone with 5 different medulla neuron types (Dm3, Tm8, Y1, Tm3 and Tm18) combining uni-columnar, multi-columnar, local and projecting neurons labeled by GFP and RFP. The nomenclature for each clone is indicated below. Medulla and lobula neuropils stained in blue with DN-cadherin.
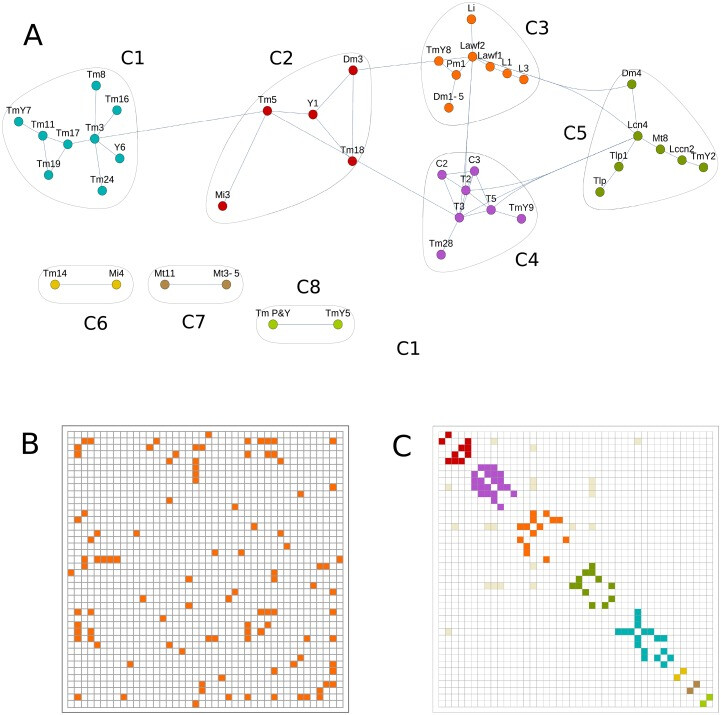
Community detection techniques find clusters of neurons related by lineage.
(A) Community detection graph for R≥0.75 and clones with quality of 2–4. This graph represents the optimal modularity value and identifies 8 communities (C1 to C8) of neuron types with tightly connected nodes, indicating that each group may be the product of one class of NB. (B) Adjacency matrix from the previous graph indicating the connected nodes. This matrix can be arranged in communities by adding a color code (C).
The above three images are from: A network approach to analyze neuronal lineage and layer innervation in the Drosophila optic lobes - PMC
Note: This offers some interesting looks at/discussion of ‘clone’ neurons and finding patterns in the macrostructures.
4 Likes
Keywords: Mi13, Mi14, Mi15, TmY14
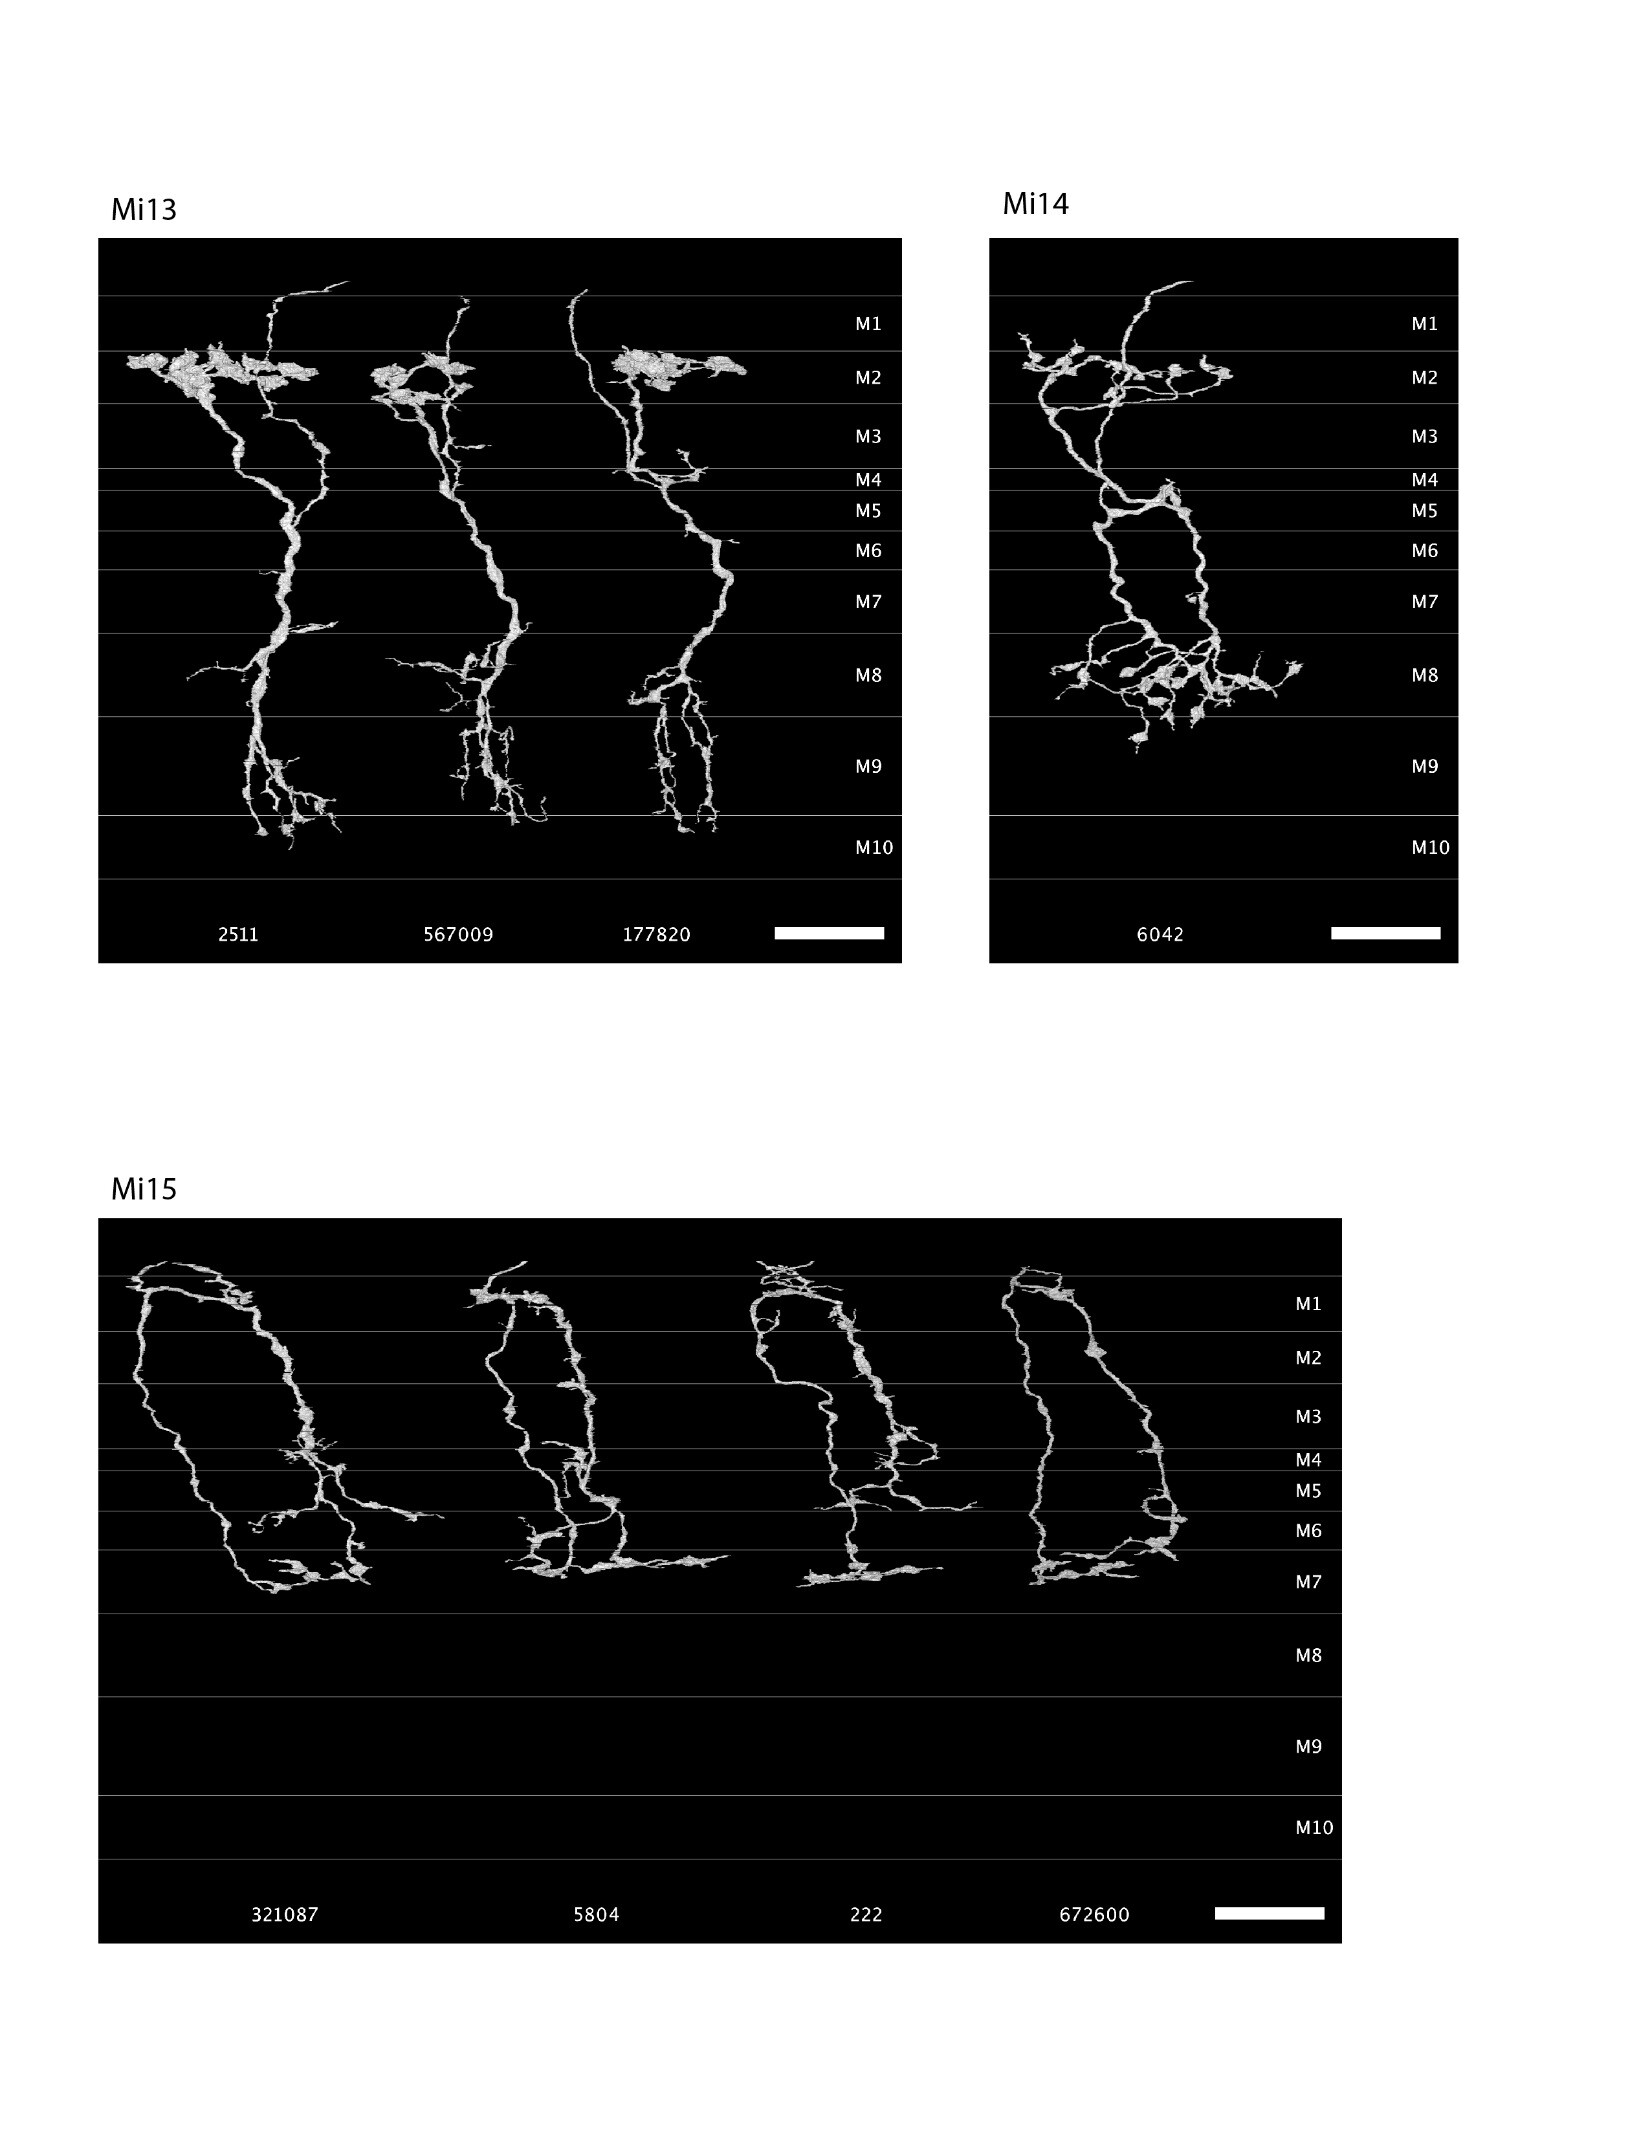
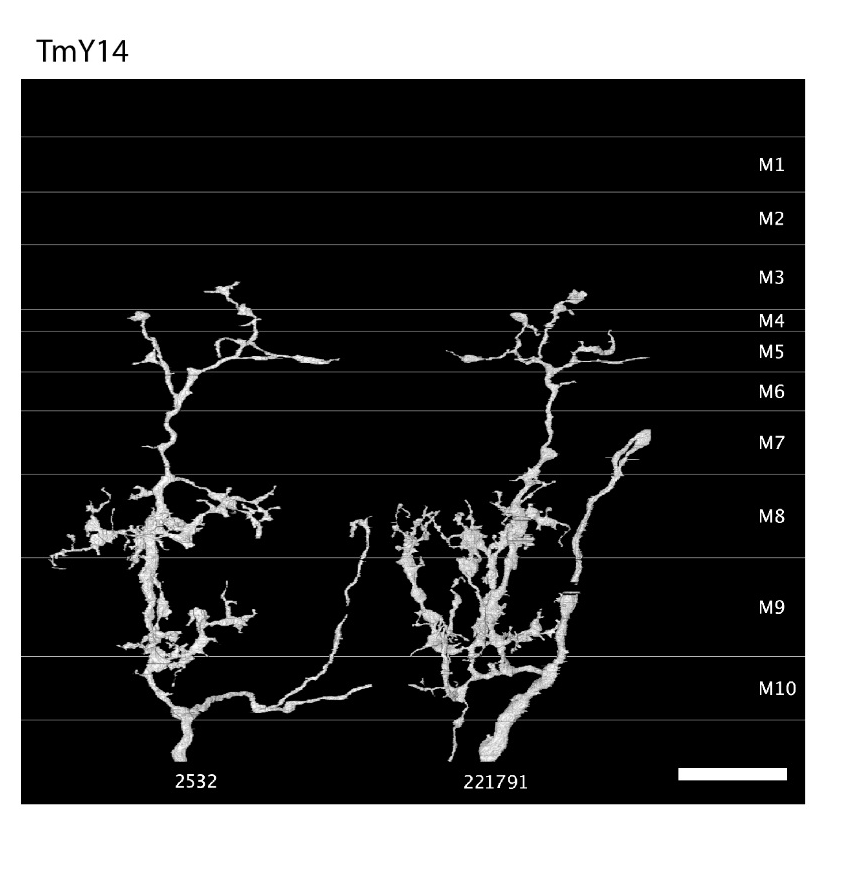
Source: https://www.researchgate.net/publication/255705988_A_visual_motion_detection_circuit_suggested_by_Drosophila_connectomics (Supplementary Material 2)
5 Likes
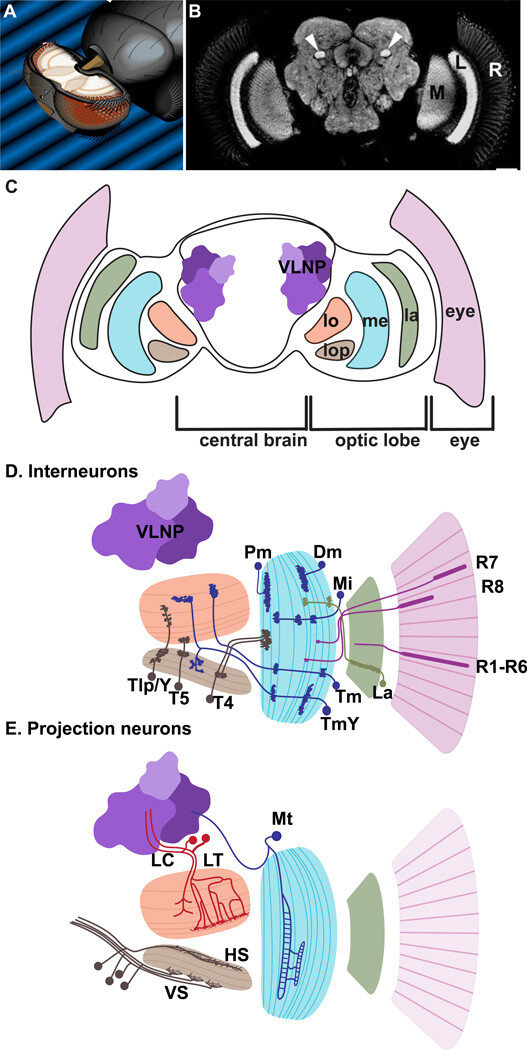
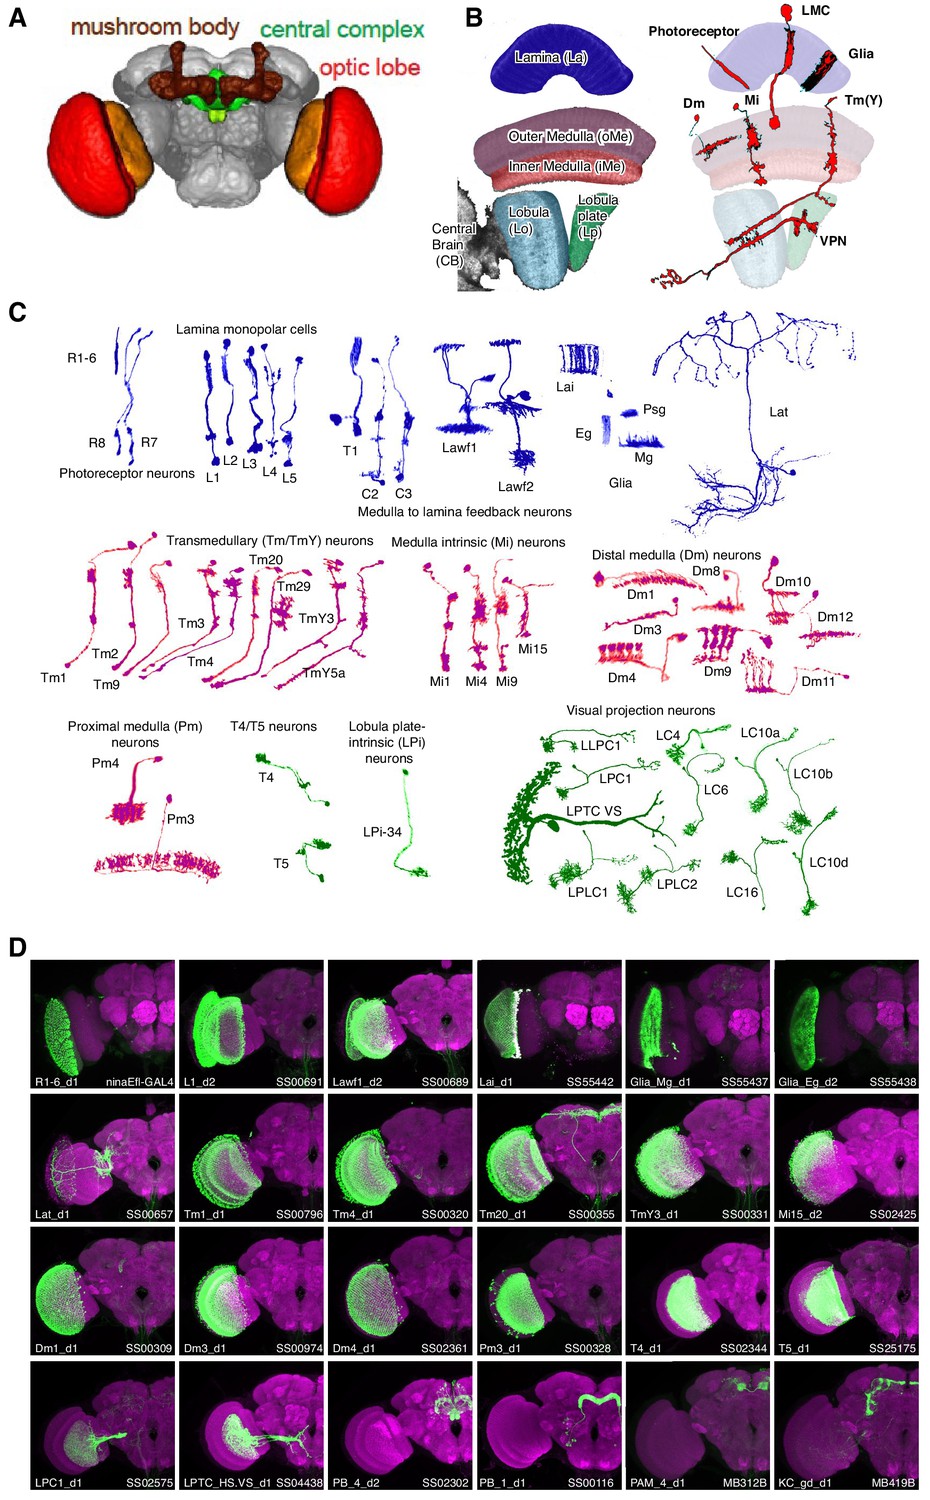
The visual system of Drosophila
(A) The fly brain in the head; adapted from (Spalthoff et al. 2012). (B) Neuropils of the optic lobes and central brain; from (Krzeptowski et al. 2014). (C) Cross-section of the fly brain indicating the different part of the visual system: eye, lamina (la), medulla (me), lobula (lo), lobula plate (lop) and ventro-lateral neuropils (VNLP). (D) Interneurons of the optic lobe: outer and inner photoreceptors (pink), Lamina neurons (La, green), Medulla interneurons (dark blue): Distal (Dm) and Proximal medulla (Pm); Medulla intrinsic (Mi); unicolumnar Transmedullary ™ or multicolumnar TmY; Lobula plate interneurons (T4, T5, Tlp and Y neurons, dark brown). (E) Projections neurons: Medulla tangential (Mt, dark blue); Lobula columnar (LC, red) and tangential/tree-like (LT, red); Lobula plate tangential cells: HS and VS (dark brown). (D, E) adapted from (Erclik et al. 2009)
Source: From The Eye To The Brain: Development Of The Drosophila Visual System - PMC
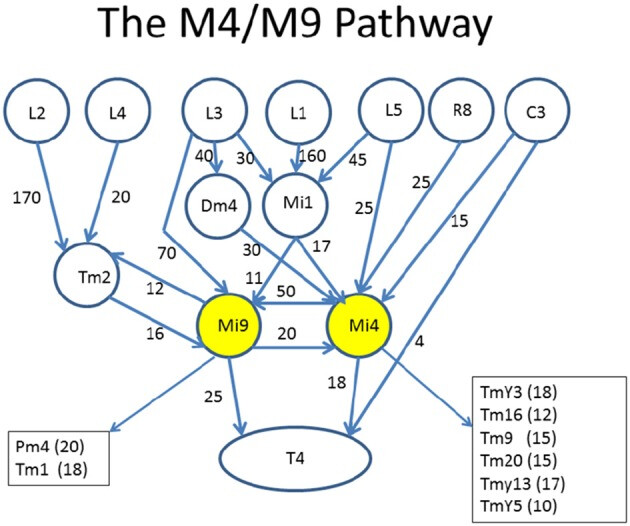
Circuits leading to Mi4 and Mi9, and hence to the motion detecting cell T4. To facilitate human understanding, the signal flow is largely uni-directional (top to bottom in this case), there are relatively few line crossings, and the edges are annotated with weights. This diagram was drawn manually, but automated and semi-automated tools to create such diagrams would be helpful. Data from Takemura et al. (2015).
Source: Analysis Tools for Large Connectomes - PMC
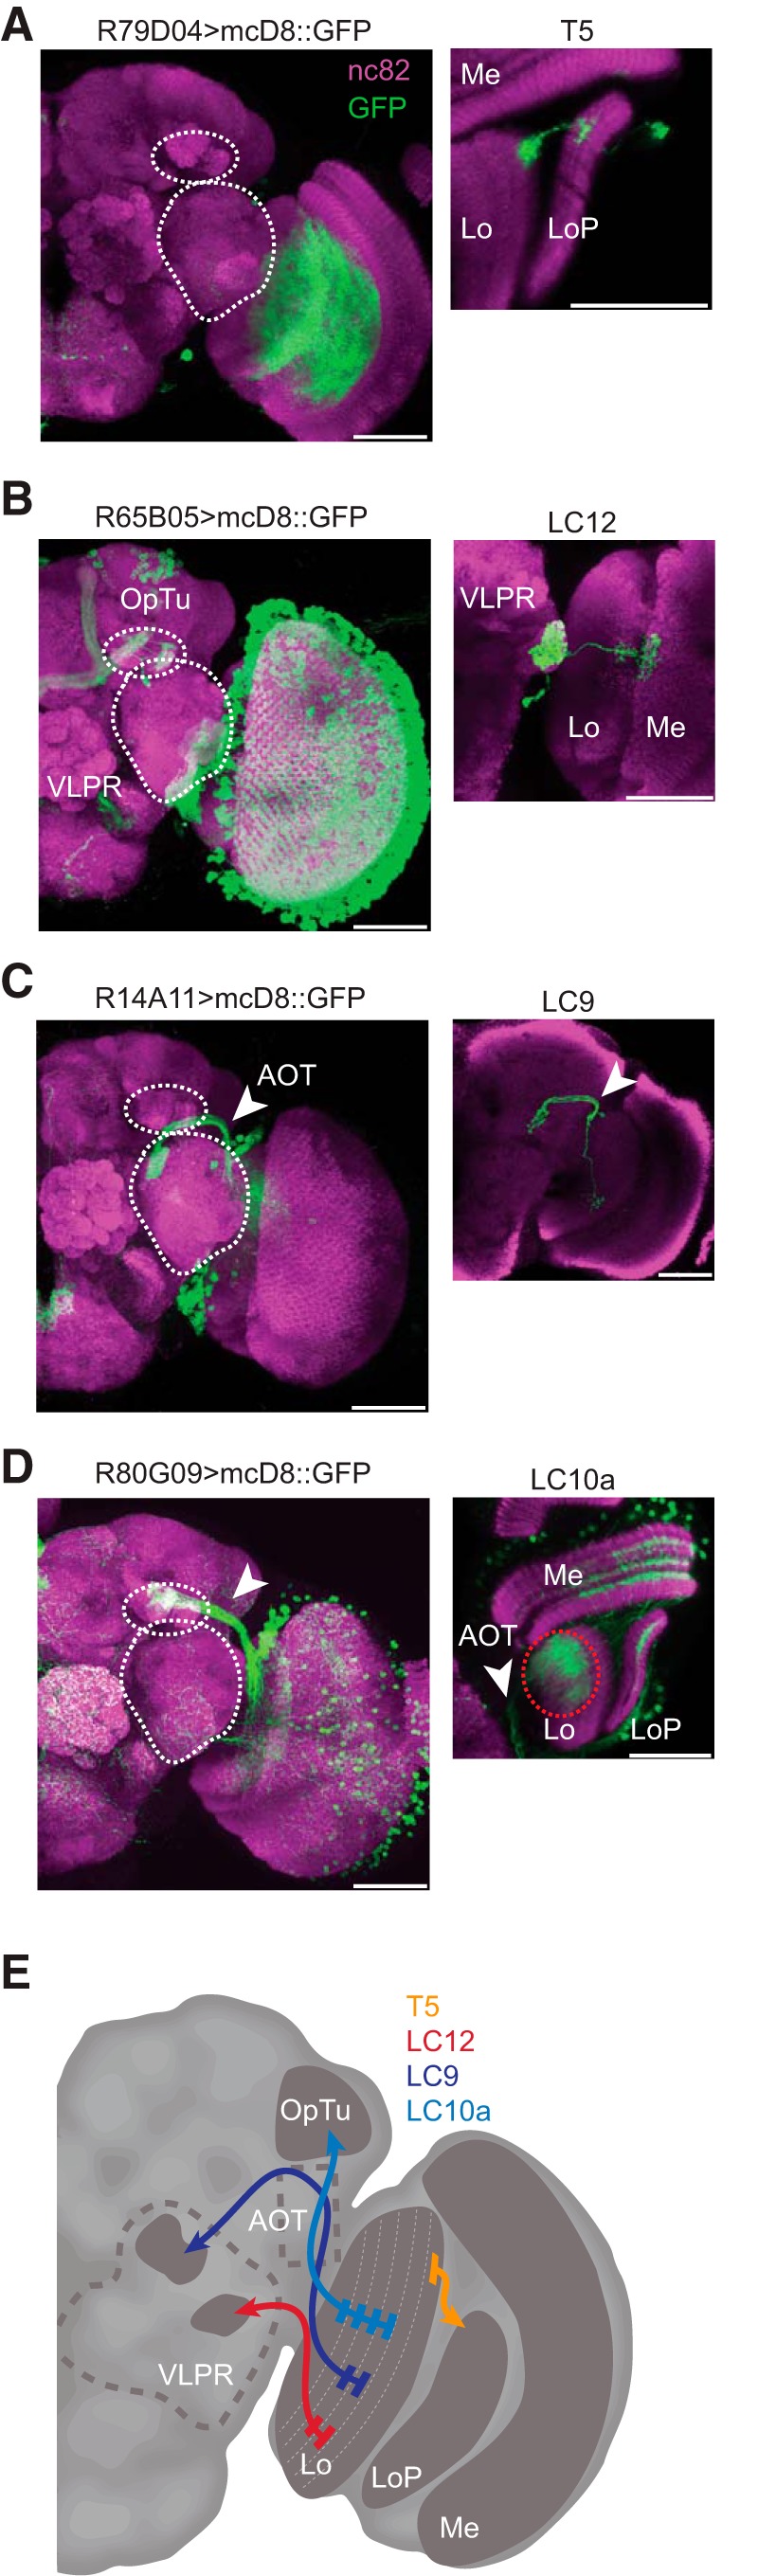
Anatomy of lobula projection neurons. All confocal images indicate nc982 neuropil staining in magenta and GFP in green. Scale bars, 50 μm. A , Whole-hemisphere labeling for R79D04 Gal4 line and single-cell example (inset) of a T5 neuron. B , Whole-hemisphere labeling for R65B05 Gal4 line and single-cell example (inset) of a LC12 neuron (shown glomerular region contains projections from multiple cells but only one of them shown); white dashed circles bound the optic tubercle (OpTu) and VLPR. C , Whole-hemisphere labeling for R14A11 Gal4 line and single-cell example (inset) of a LC9 neuron (shown glomerular region contains projections from multiple cells but only one of them shown). D , Whole-hemisphere labeling for R80G09 Gal4 line. We were unable to achieve single-cell labeling in this line, yet identified the LC10a subtype based on the axonal projections being confined only to the medial part of the optic tubercle (arrowhead). E , A schematic diagram depicting the input layers of the lobula and the projection targets of each cell type imaged (Mu et al., 2012).
Source: Neurons Forming Optic Glomeruli Compute Figure–Ground Discriminations in Drosophila - PMC
4 Likes
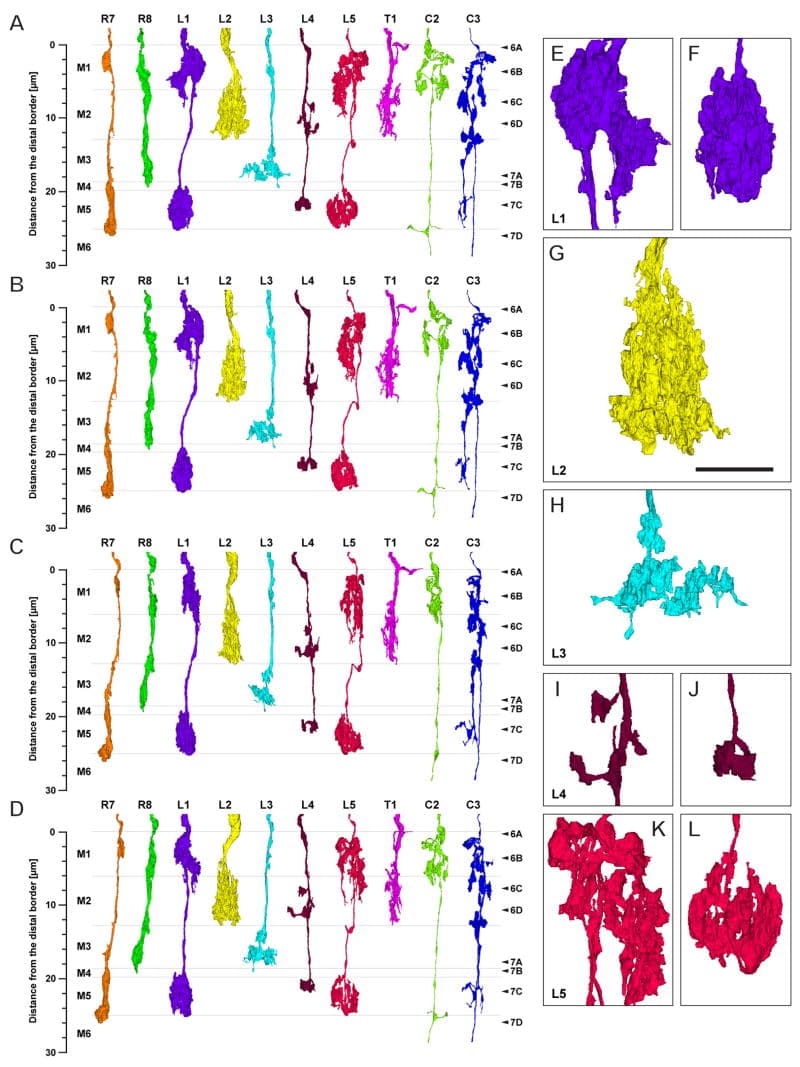
Profiles of the 10 cells reconstructed in three dimensions from column 2 in Fig. 2: R7 and R8, L1–L5, C2 and C3, and T1. Because the column is oval in cross section, each cell is shown from four views: from anterior looking posterior (A), in the plane of the chiasma, from dorsal looking ventral (C), and oblique views rotated 45° from the dorsal towards anterior (B) or towards the posterior (D). Borders are indicated between strata M1–M6. Estimated scale of the distance from the distal edge of stratum M1 is shown in the left side. The levels of panels in Figs. 6 and and77 are shown by arrowheads (right side). Enlarged images of terminal arbors of L1–L5 in a posterior view looking anterior (E–L): L1’s bi-lobed arbor in stratum M1 (E) and clubbed terminal in stratum M5 (F); L2’s terminal arbor in stratum M2 (G); L3’s terminal arbor in stratum M3 (H); L4’s spreading arbor in stratum M2 (I) and small terminal in stratum M5 (J); L5’s branched arborization in strata M1/M2 (K) and compact clump in stratum M5 (L). Scale bar: 5 μm (in G, same magnification for E–L)
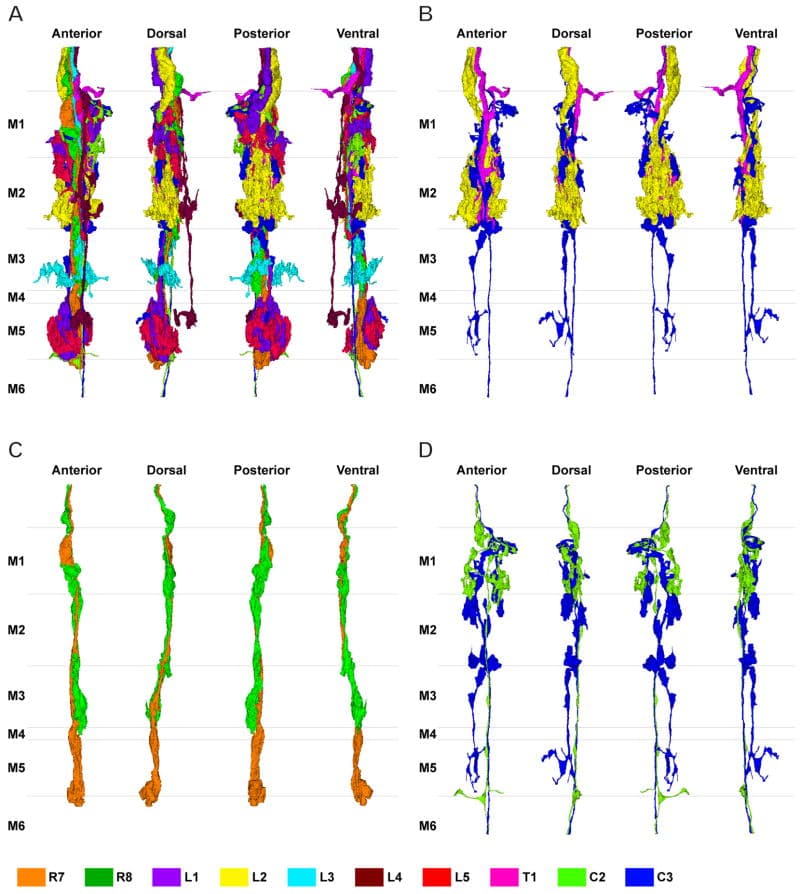
Reconstruction of multiple terminals in a single column shown together from four different views at successive 90° rotations in a anticlockwise direction, from the distal surface looking in (far left: view from anterior looking posterior). A: 10 cells reconstructed together. B: C3 (blue) makes contact with L2 (yellow) and T1 (pink) in strata M1 and M2. C: R8 (green) travels with R7 (orange), and is presynaptic to R7. D: The main axon of C2 (yellow-green) and C3 (blue) travel side by side through the medulla within the column.
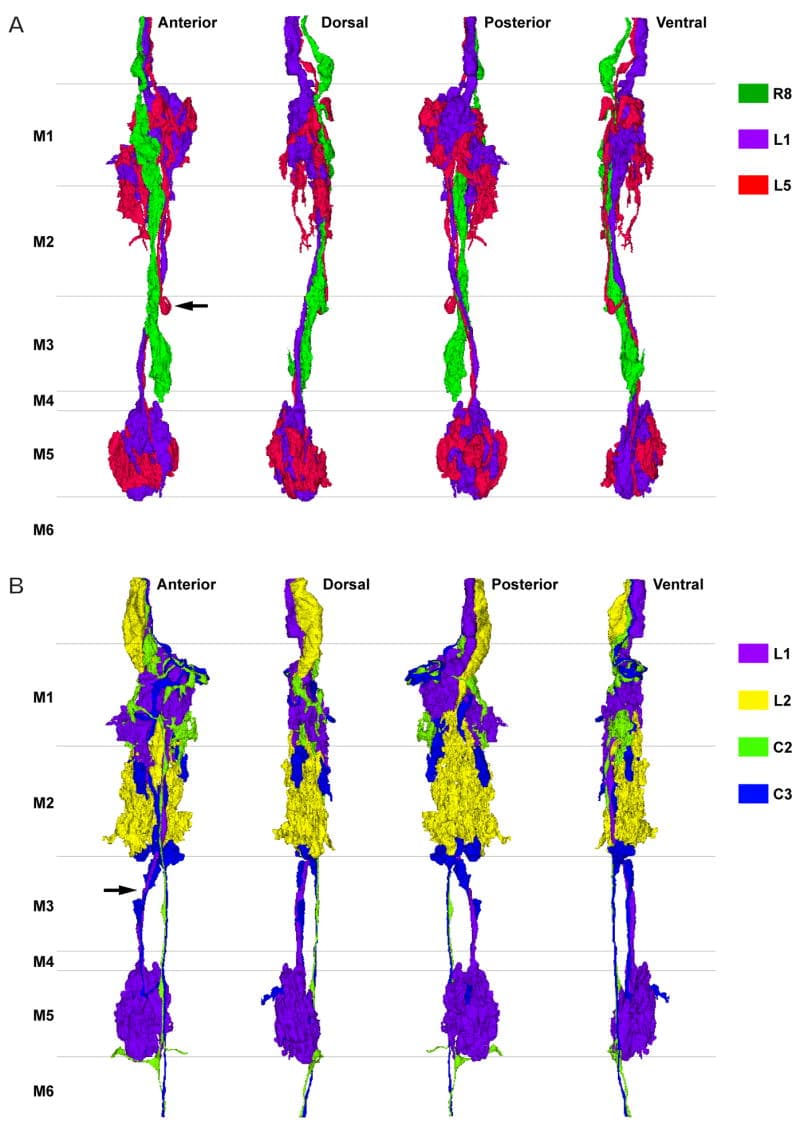
A: Reconstruction of the terminals of R8 (green), L1 (purple) and L5 (red). The terminals of L1 and L5 overlap each other closely and have reciprocal synaptic connections in strata M1 and M5. R8 is presynaptic to both L1 and L5 in stratum M1. The axon of L5 has a characteristic inflection around the depth between strata M2 and M3 (arrow). B: Reconstruction of L1 (purple), L2 (yellow), C2 (green), and C3 (blue). C3’s short collateral arising from its main axon at the border between strata M2 and M3 travels along the axon of L1 and has synaptic contacts in stratum M5 (arrow). C2 and C3 have numerous synaptic contacts with L1 and L2 (see text for details).
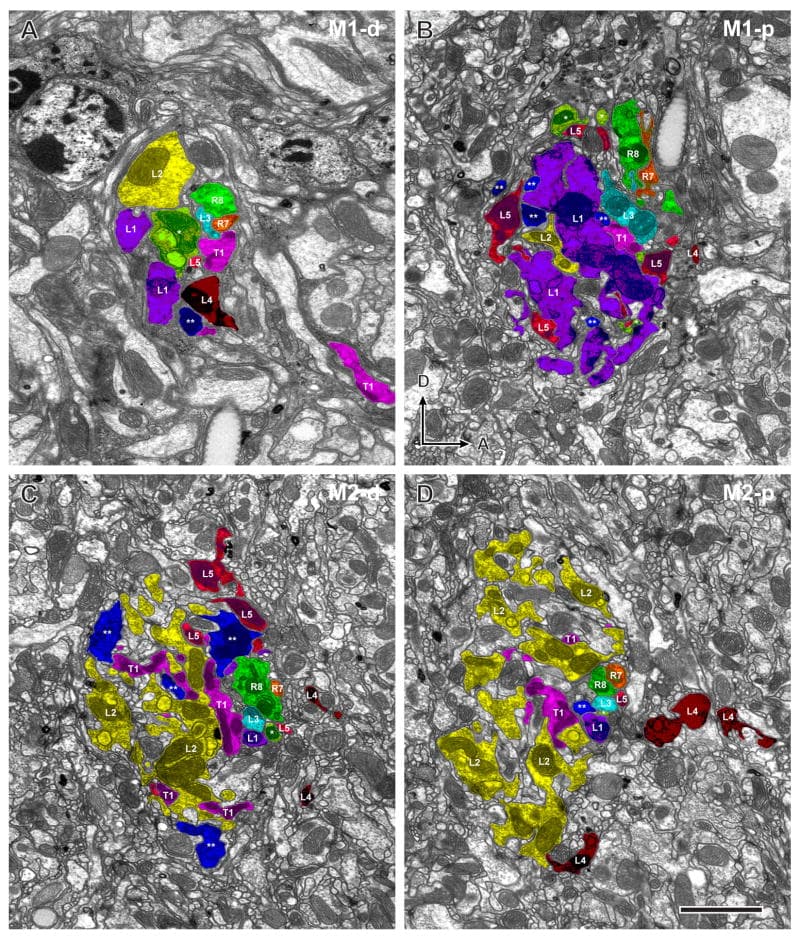
Four sections of column 2 from a series of 530 aligned images reveal profiles of all input terminals in the two outermost strata. Profiles of each cell are colour-coded as in Fig. 3, as follows: orange (R7), green (R8), purple (L1), yellow (L2), sky-blue (L3), dark-red (L4), pale-red (L5), yellow-green (C2), blue (C3), and pink (T1). A: Distal region of stratum M1 (M1-d) showing the axon bundle at the chiasma/neuropile border (section no. 73). B: Proximal region of stratum M1 (M1-p) at the level of the expanded terminals of L1 (section no. 123). C: Distal region of stratum M2 (M2-d) at the level of the expanded terminal of L2 (section no. 191). D: Proximal region of stratum M2 (M2-p) containing profiles of the L2 terminal and the divided profiles of the L4 arborization (section no. 240). Dorsal (D) and anterior (A) directions indicate the orientation of the head (in B, for all images). Scale bar: 2 μm (in D, for all images).
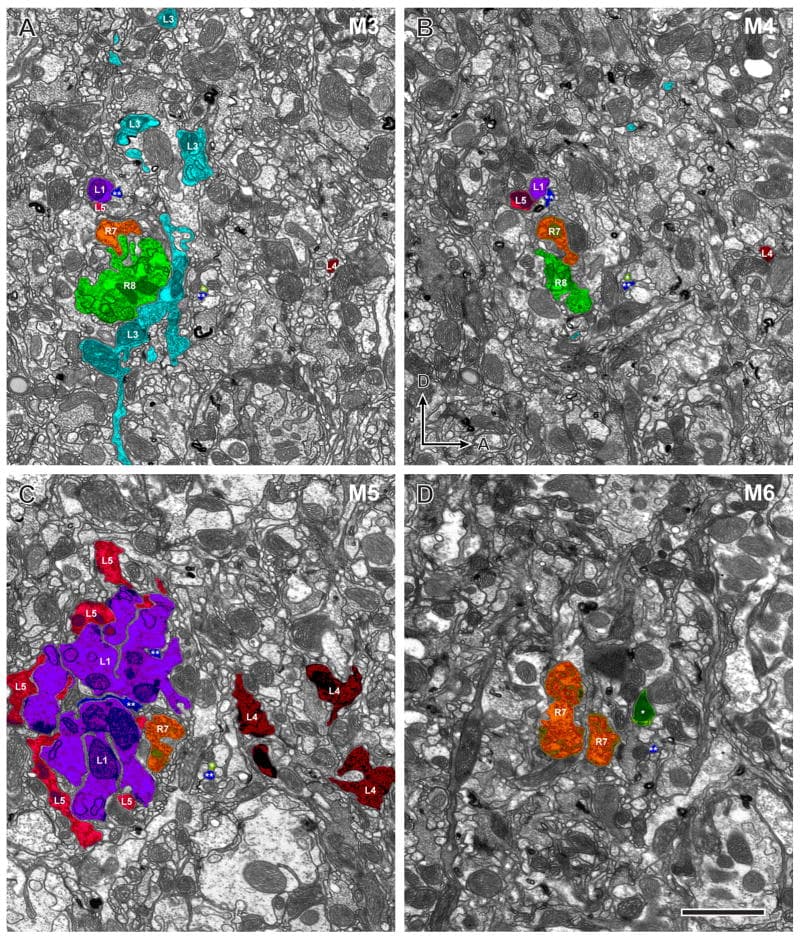
Four sections of column 2 in strata M3–M6, continuing those of Fig. 6. A: Stratum M3 containing the spreading terminals of L3 (section no. 347). Note that the dorso-ventrally directed processes of the L3 terminal extend slightly beyond the border of the panel. B: Stratum M4 (section no. 364). C: Stratum M5 at the level of the terminal of L5 and the proximal terminal of L1 showing the three terminals of L4 (section no. 416). D: Stratum M6 at the level of the profiles of the surviving R7 terminal (section no. 479). Dorsal (D) and anterior (A) directions indicate the orientation of the head (in B, for all images). Scale bar: 2 μm (in D, for all images).
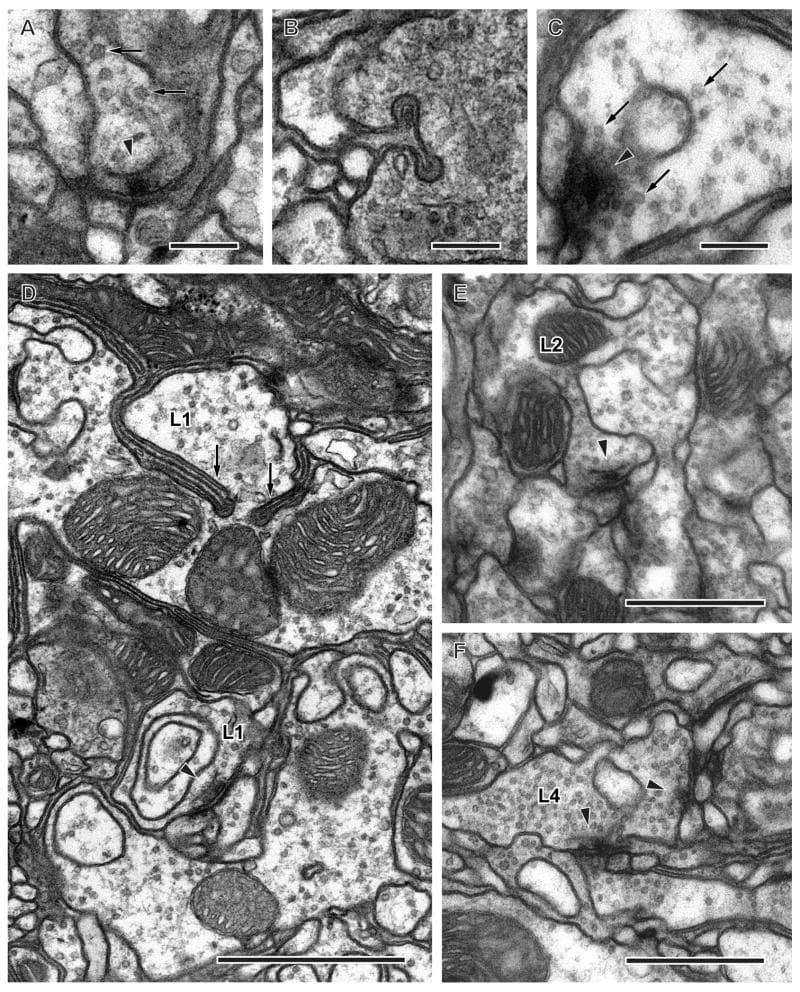
Synaptic organelles of photoreceptor and lamina cell terminals in the medulla. A: Presynaptic T-bar ribbon (arrowhead) and synaptic vesicles (arrows) in the photoreceptor terminal R8. B: Invaginating organelle, resembling a capitate projection, in the photoreceptor terminal, arising from an unidentified glial cell. C: Cruciform presynaptic density (arrowhead), the en face view of the pedestal of a T-bar ribbon, and surrounding synaptic vesicles (arrows) in L1 terminal. D: Terminals of L1 have thin invaginating partitions in stratum M5 (arrows). Arrowhead indicates cross-sectioned presynaptic T-bar ribbon in L1 profile. E: L2 is presynaptic to unknown profiles which are probably medulla cells (arrowhead). F: L4 is presynaptic to unidentified profiles which are probably medulla cells in stratum M5 (arrowheads). Scale bars: 0.2 μm (AC); 1 μm (D); 0.5 μm (E, F)
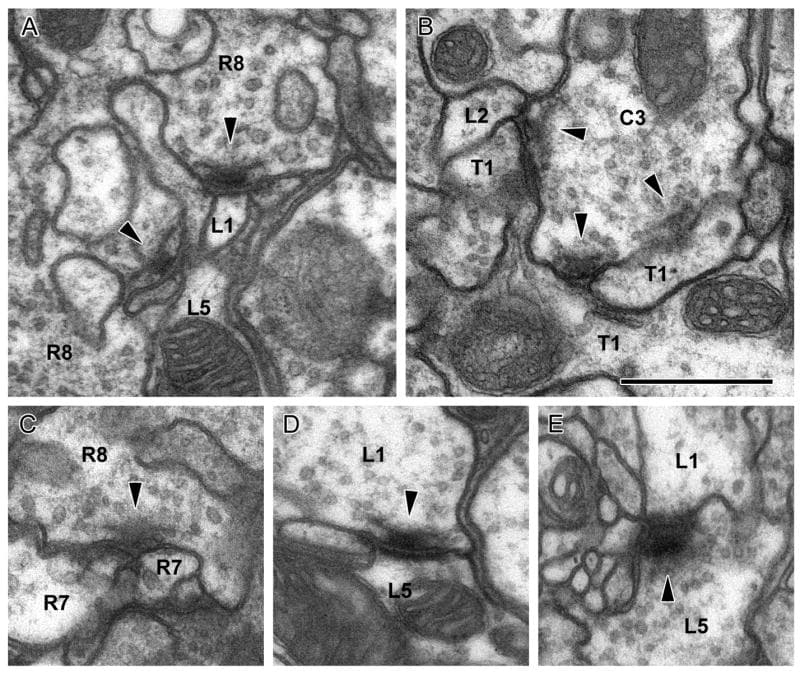
Synaptic contacts between input terminals in the medulla column. Arrowheads: T-bar ribbon in presynaptic elements. A: R8 provides input upon L1 and L5. B: C3 provides input upon L2 and T1. C: R8 provides input upon R7 at a dyad. D: L1 provides input upon L5, which is reciprocated at a second site (E). All synapses are of the multiple-contact type and additional postsynaptic elements are not identified. Scale bar: 0.5 μm (in B, for all images).
Source for all images: Synaptic circuits of the Drosophila optic lobe: the input terminals to the medulla - PMC
4 Likes
I’ve found a paper with some new cells (screenshots below). What’s important, is that the pape contains name that is the same in a different paper for a different cell - Mt(new)1 (post).
That’s why it’s important, at least for the newer cells to not only add the cell’s short and long name but also the source. The other reason is, ofc, that the same type of cells can have different names in different papers.
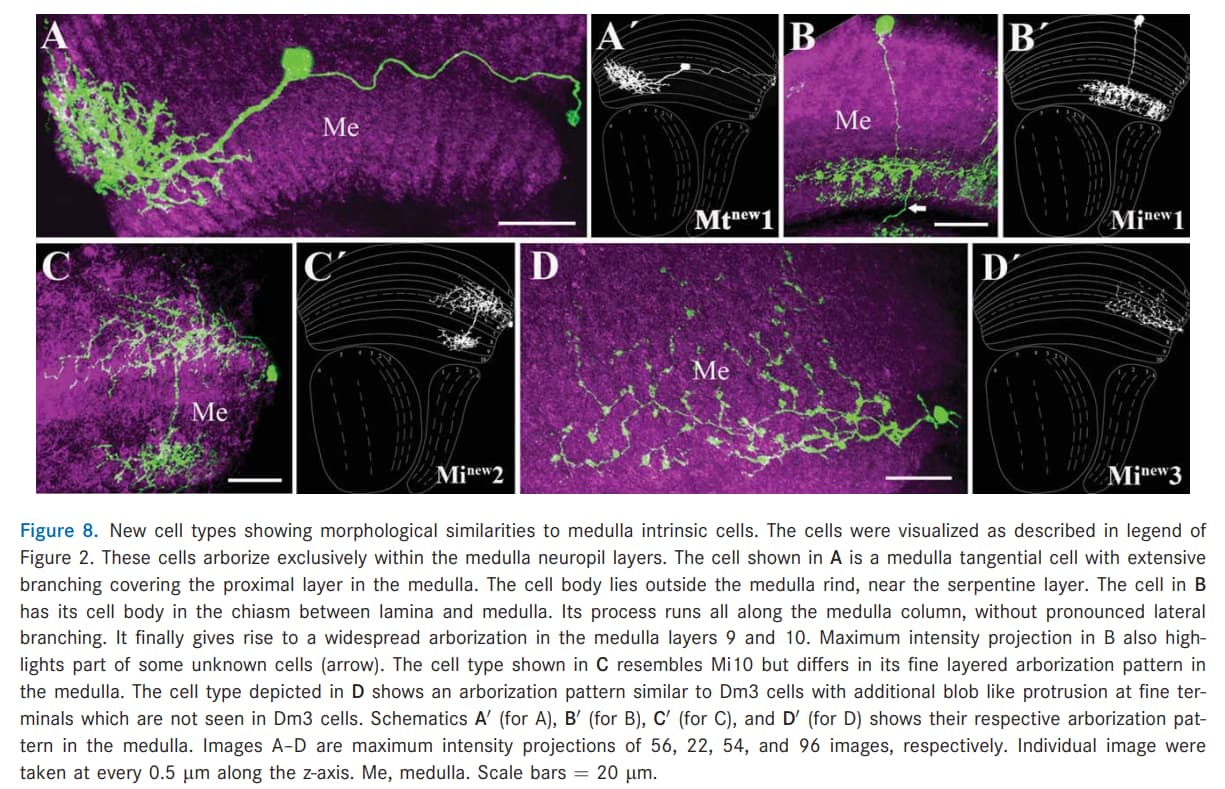
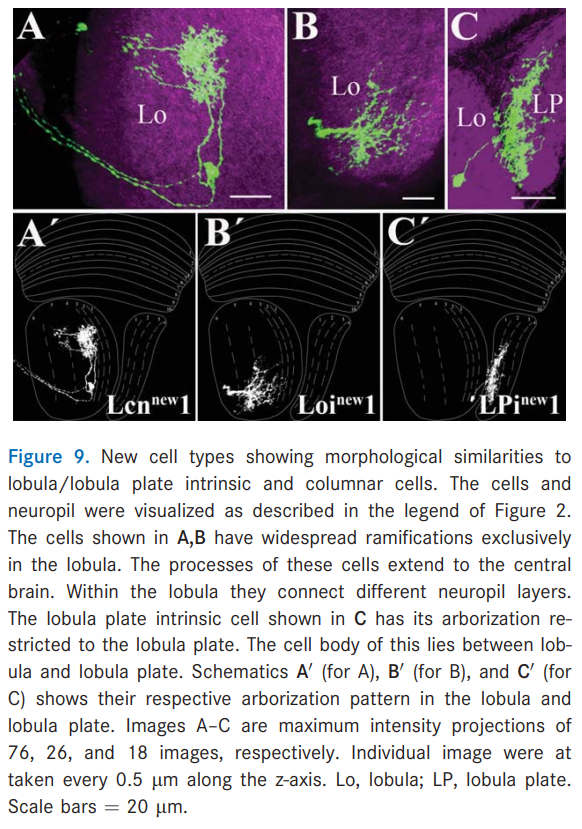
The source is " Neurons with cholinergic phenotype in the visual system of Drosophila" by Shamprasad Varija Raghu, Dierk F. Reiff, and Alexander Borst (2011). https://doi.org/10.1002/cne.22512
Can’t give an online source for the full text, because I only found it as a pdf on some shady website.
Keywords: Mt(new)1, Mi(new)1, Mi(new)2, Mi(new3), Lcn(new)1, Loi(new)1, LPi(new)1.
There’s also this Loi(new)1 cell. I wonder, if this is a different name for Li cells or some new category.
4 Likes
And another example of this naming problem:
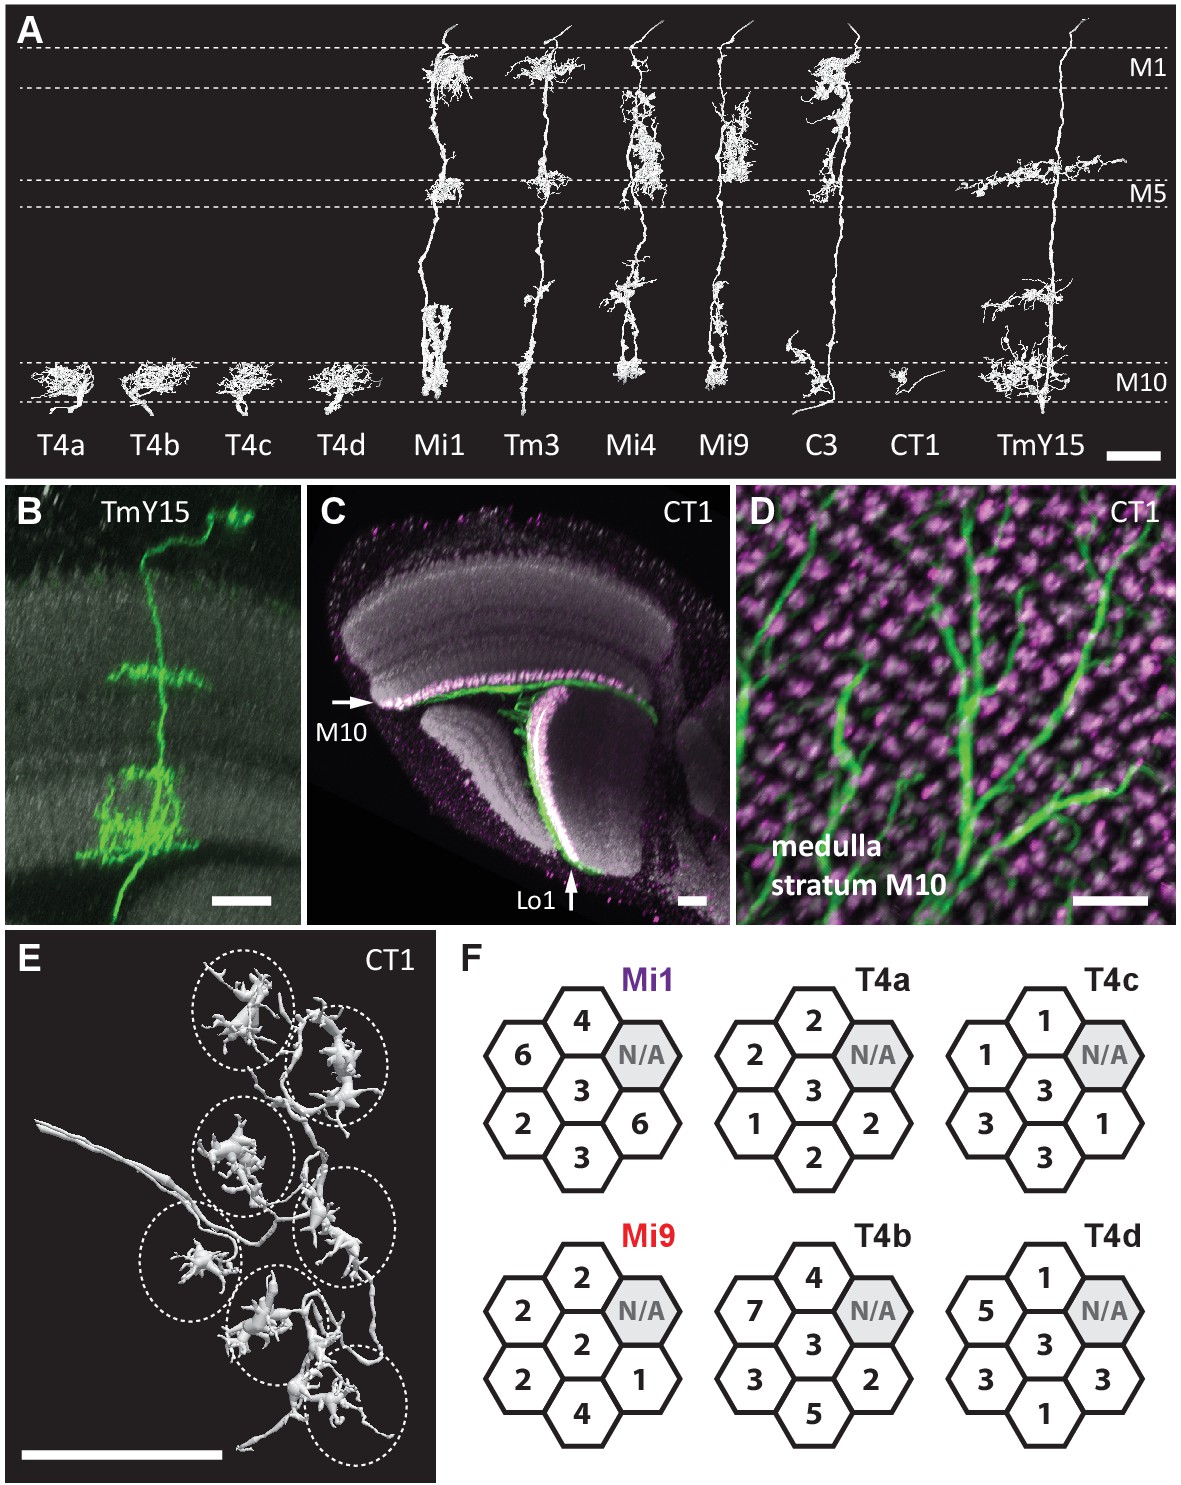
Source: The comprehensive connectome of a neural substrate for ‘ON’ motion detection in Drosophila | eLife
TmY15 from this picture looks quite different than the one from this picture from AJ’s post.
4 Likes