Thanks AzureJay! These are very helpful!
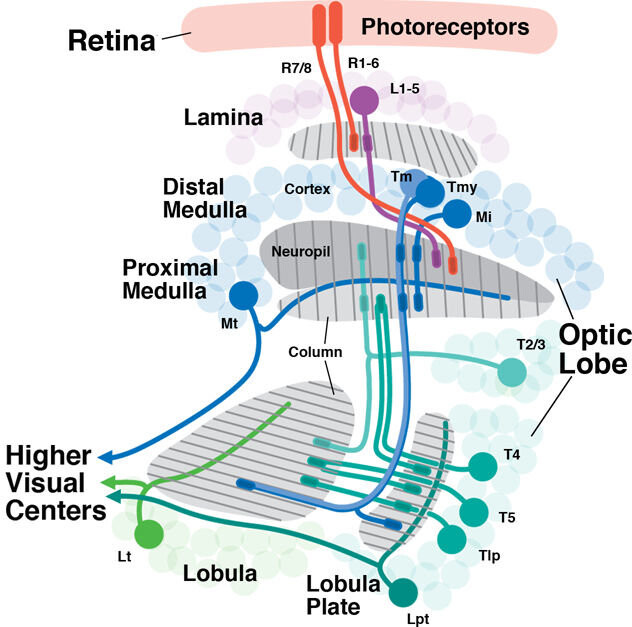
I’ve also spent some time color coding and distilling down cell names from the Fischbach paper which you can find here:
(Also links to the paper for whoever needs the reference).
Happy proofreading!
Thanks AzureJay! These are very helpful!
I’ve also spent some time color coding and distilling down cell names from the Fischbach paper which you can find here:
(Also links to the paper for whoever needs the reference).
Happy proofreading!
This is great, thank you Celia!
Since there’s been a lot of discussion recently about connectivity and circuits, went looking for a few useful diagrams!
Overview of neuronal connectivity in the Drosophila visual system.
Keywords: connectome, optic lobe
Source: May 2017 paper
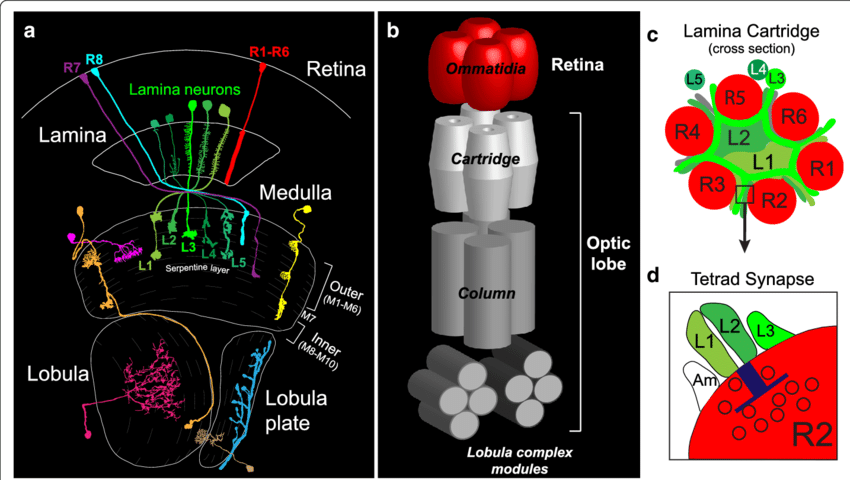
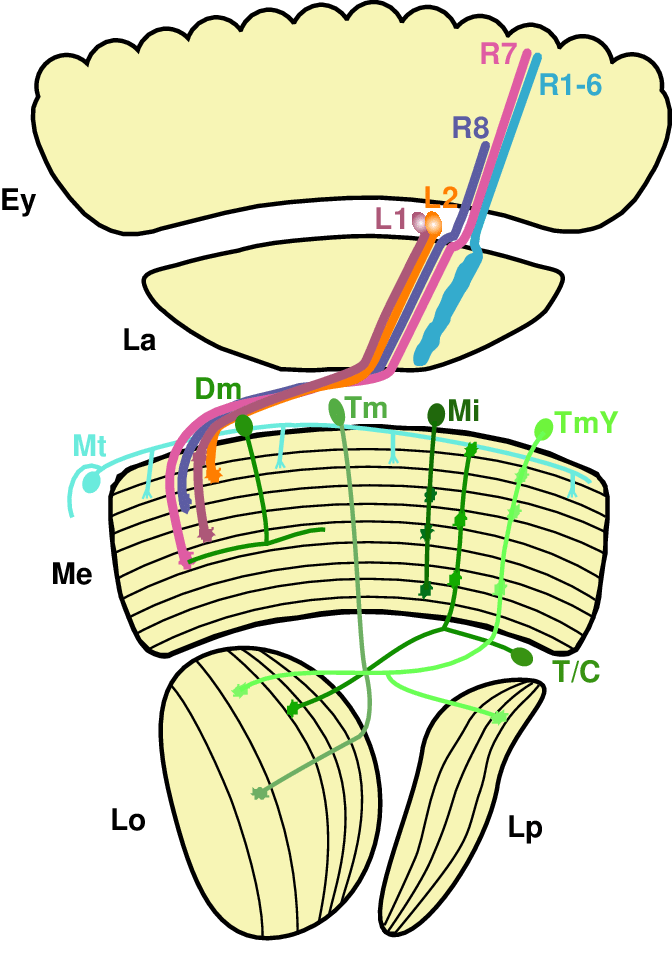
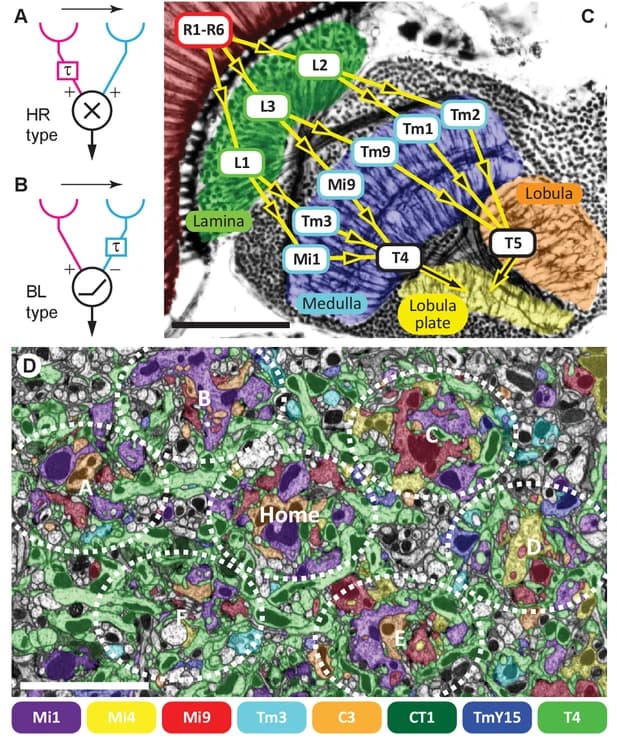
The Drosophila visual system. (a) Anatomy of the Drosophila visual system (Adapted from Fischbach and Diettrich 1989). (b) Diagram illustrating the modular organization of the Drosophila visual system. Four topographically matched modules from the retina and each region of the optic lobe are shown. Ommatidia (retina), cartridge (lamina), column (medulla), lobula complex modules (lobula and lobula plate). (c) Illustration of a cross section through a lamina cartridge. The axons of R1-R6 photoreceptors synapse onto the dendrites of L1-L3 lamina neurons. The R cell axons form a ring around the dendrites, establishing a cylindrical structure that may optimize wiring efficiency. (d) R cell axons form tetrad synapses. At each R cell synapse, input is provided to four postsynaptic elements. L1 and L2 are present at every R cell synapse, but the other two components are variable and can include L3, amacrine (Am) or glial (not shown) processes
Keywords: lamina cartridge, lamina neurons, photoreceptors, retina, medulla
Source: Article, June 2018
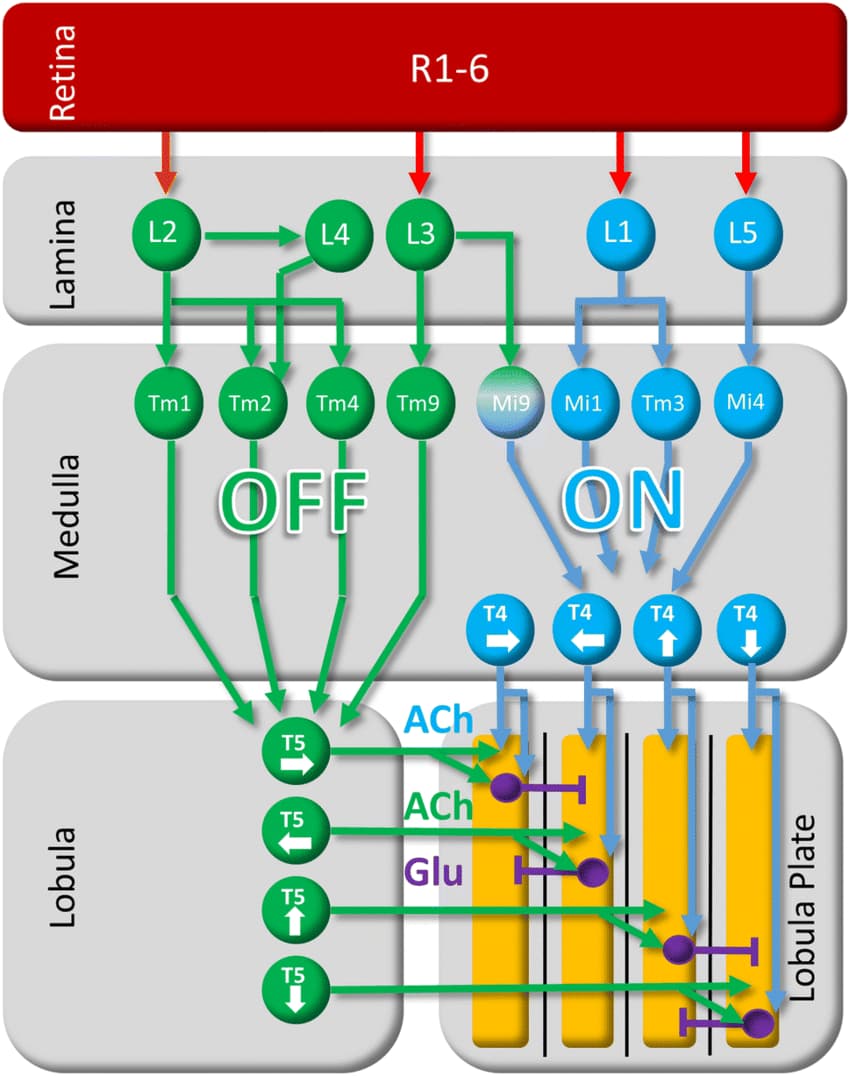
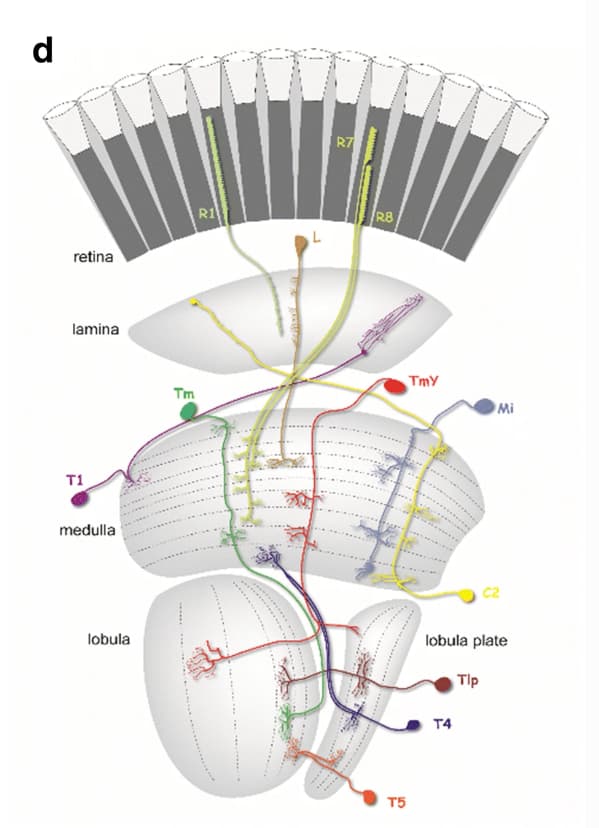
General layout of the neural circuit for motion vision in Drosophila. Note that the actual circuitry is more complex, in particular with respect to the medulla neurons involved as well as their synaptic interactions. ACh acetylcholine, Glu glutamate
Source: Article Mar 2020
Wow this is a fantastic resource! In case it’s easier to click through, we turned that doc @Celia_D made into this slide deck.
Got a big collection here from a single paper (sourced at the end of the post), primarily focused on the lobula plate, T4, T5, LPi, and new types of TmY, Y, and Tlp. Along with some connectivity for those of you interested!
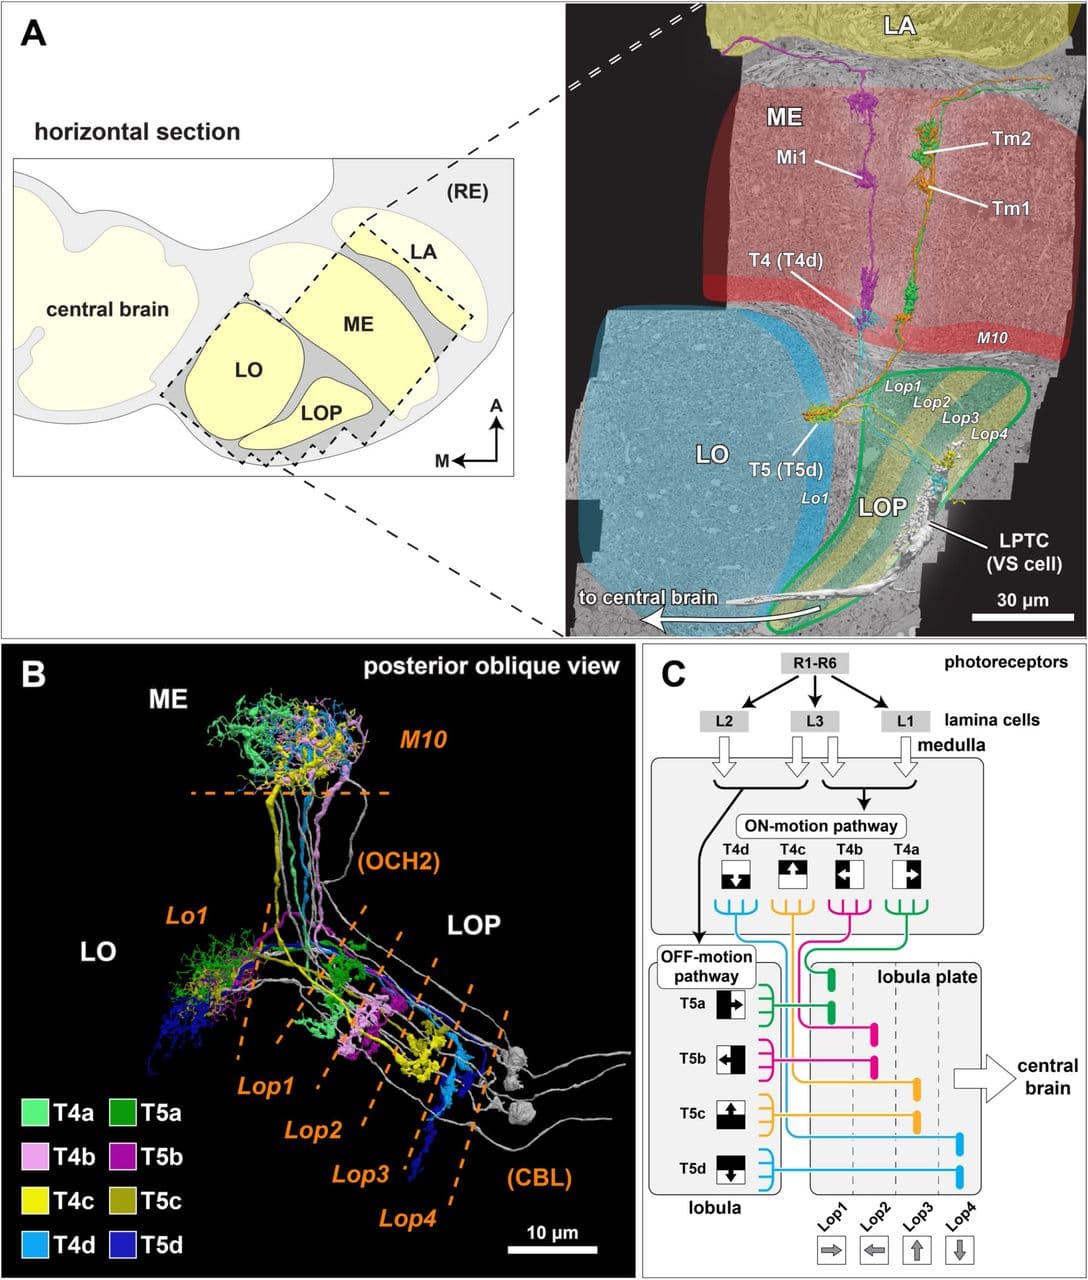
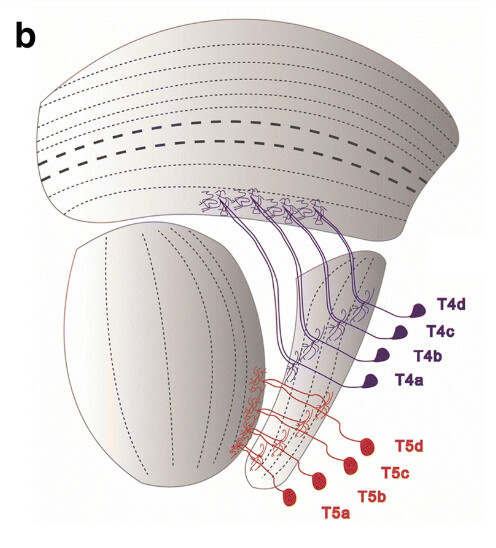
(A) The optic lobe FIB-SEM dataset covers a subvolume of the medulla (ME), lobula (LO), and lobula plate (LOP), as well as the proximal part of the lamina (LA), selected to contain many connected neurons of the motion pathway. The data set was imaged with voxel size x = y = z = 8 nm, and the size of the image stack is 19,162 × 10,657 × 22,543 pixels, equivalent to 153 μm x 85 μm x 180 μm 22. In the right panel, representative neurons in the ON- and OFF-motion pathways in the medulla and the lobula, as well as a lobula plate tangential cell (VS cell) are shown (panel adapted from Shinomiya et al. 22). M: medial, A: anterior. (B) Subtypes of the T4 and T5 cells. The T4 cells receive inputs onto their dendrites in medulla layer 10 (M10), T5 neurons receive dendritic input in lobula layer 1 (Lo1). Both cell types project through the non-synaptic second optic chiasm (OCH2) and stratify into the four layers of the lobula plate (Lop1-Lop4). The cell bodies are located at the cell body layer (CBL) in the lobula plate cortex. The cell bodies and the cell body fibers are shown in gray, while some cell bodies are not shown. (C) A schematic diagram of the motion circuit. Local luminance is detected by the photoreceptors R1-R6 in the retina. The signals are relayed to the lamina cells (L1, L2, and L3), which send outputs to various columnar cells in the medulla (not detailed here). The 4th order T4 and T5 neurons integrate inputs from the ON and OFF motion pathway neurons, respectively, and project to the lobula plate. The four subtypes (a, b, c, and d) detect visual motion in the front-to-back, back-to-front, upward, and downward directions, respectively, and project axons to the corresponding LOP layer where these directionally selective signals are integrated by lobula plate neurons.
(A) The inputs and outputs of representative T4 and T5 cells (five cells per each subtype; see text for details, also File S1) in the lobula plate were comprehensively identified. The input and output cells were grouped by the cell type, and inputs and outputs corresponding to a mean of more than five synapses per T4 or T5 cell are shown in the diagram. The thickness of the arrows indicates the average number of synapses per T4 or T5 cell. Each rectangle indicates a cell type; colored rectangles correspond to uniquely identified cells, and gray rectangles represent neurons we could not uniquely identify due to incomplete reconstruction. For unidentified neurons, the main innervated layers are shown in italic letters. For example, Lop(1)34 means that the fragment has major arbors in Lop3 and Lop4, and minor arbors in Lop1. LPi are lobula plate intrinsic cells, the TmY/Y/Tlp neurons connect the optic lobe neuropils, and LPTC and LPLC/LLPC/LPC cells are visual projection neurons (VPNs) that send outputs to the central brain. (B) Average numbers of output synapses from single T4 and T5 per postsynaptic cell type. Neurons are color-coded by the layer where they receive inputs from T4 and T5. Generally, outputs from T4 and T5 (and therefore inputs to their target neurons) are approximately evenly integrated by the postsynaptic cells, with a slight bias for T5. All named neurons receiving more than an average of 20 synapses from both T4 and T5 are labeled (LPLC2 is labeled for all four layers). The dashed lines indicate 25% and 50% difference from equal numbers of output from T4 and T5 to any target cell type. (C) Total numbers of input and output synapses of the representative T4 and T5 cells. Autapses (self-synapses) and synaptic contacts with glia are excluded from this quantification. Averaged synapse numbers of each cell type (five individual neurons per each cell type) are indicated as gray crosses.
(A, B) The three HS cells (HSN, HSE, and HSS) occupy Lop1, the fist layer of the lobula plate. Collectively the dendrites of these neurons span Lop1 and overlap in the region of the lobula plate within our data volume, but are cut off at the edges of the volume. (A) posterior view, (B) ventral view. (C, D) The ten identified VS cells in our data volume. All have postsynaptic terminals in Lop4, while four of them also have branches in Lop2. (C) posterior view, (D) ventral view. (E) Examples of major input neurons to the HS and VS cells in the lobula plate. Single dendritic arbors (length ~20 μm) of one HS cell and one VS cell are shown in white. HS dendrites primarily receive input from the T4a, T5a, and LPi2-1 cells in Lop1, whereas VS dendrites in Lop4 primarily receive input from the T4d, T5d, and LPi3-4 cells. The T4 terminals are not shown to minimize clutter. Yellow and gray dots represent pre- and postsynaptic sites, respectively. (F) Inputs to the HS and VS cells. Synapses are verified and counted for small pieces of the HS and VS arbors in the respective layers (two branches for each of HS and VS (Lop4) and one branch for VS (Lop2)). Almost 90% of the inputs to the HS and VS cell dendrites come from T4, T5, and the bilayer LPi cells. A similar input distribution is found for the VS cells’ branches in the Lop2 layer, where they receive inputs from the T4b, T5b, and LPi1-2 cells. Gray indicates other, more weakly connected neurons or unidentified neuron fragments, less than 10% of the total synapses (detailed in File S2). No output synapses were found on these branches. The scale bars are approximate as the neurons are three-dimensionally reconstructed.
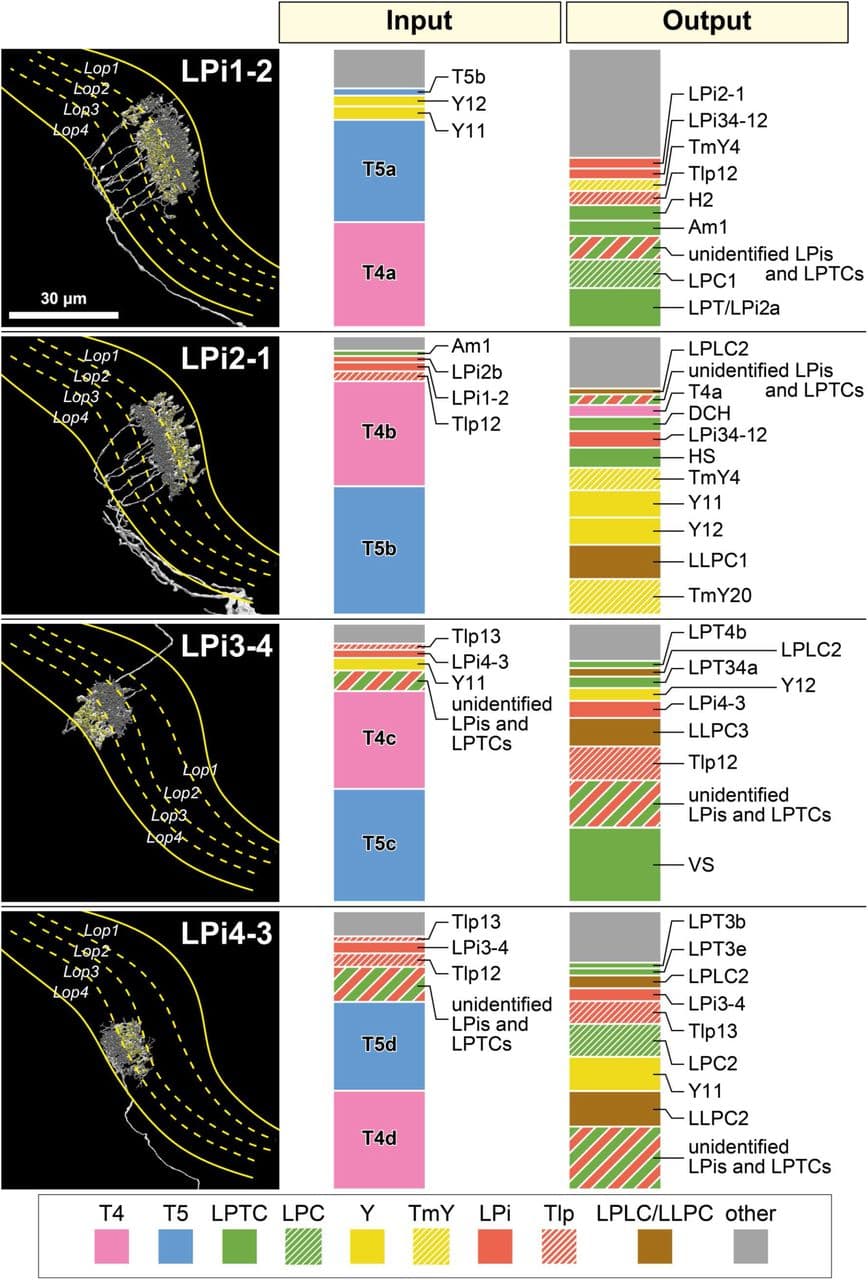
A representative cell of each neuron type is shown in the left panel. Presynaptic sites are indicated with yellow dots and postsynaptic sites are shown with gray dots. These neurons primarily integrate inputs in one layer and supply outputs to the adjacent layer. Only the LPi3-4 cell is completely reconstructed, while the other cells are only partially reconstructed, since single neurons cover larger LOP areas than the imaged data volume. A candidate light microscopy match for LPi1-2 (Figure S1) suggests the possibility that the LPi1-2 reconstructions (and perhaps also the similar LPi1-2 fragments) may be parts of one or a few large cells. In the right two panels, ratios of the input and output synapses are shown for each indicated cell type. These data are based on a single selected branch for each cell type (with 600-1000 postsynaptic sites, 100-170 presynaptic sites), for which the pre- and postsynaptic connected neurons were identified wherever possible. Cell types occupying less than 2% of the total input or output synapses are not shown and are included as “other”. A number of tangential elements that have synapses with the LPi cells were only partially reconstructed due to the restricted data volume. These fragments of considerable size are grouped as “unidentified LPis and LPTCs”. Data summary based on File S3.
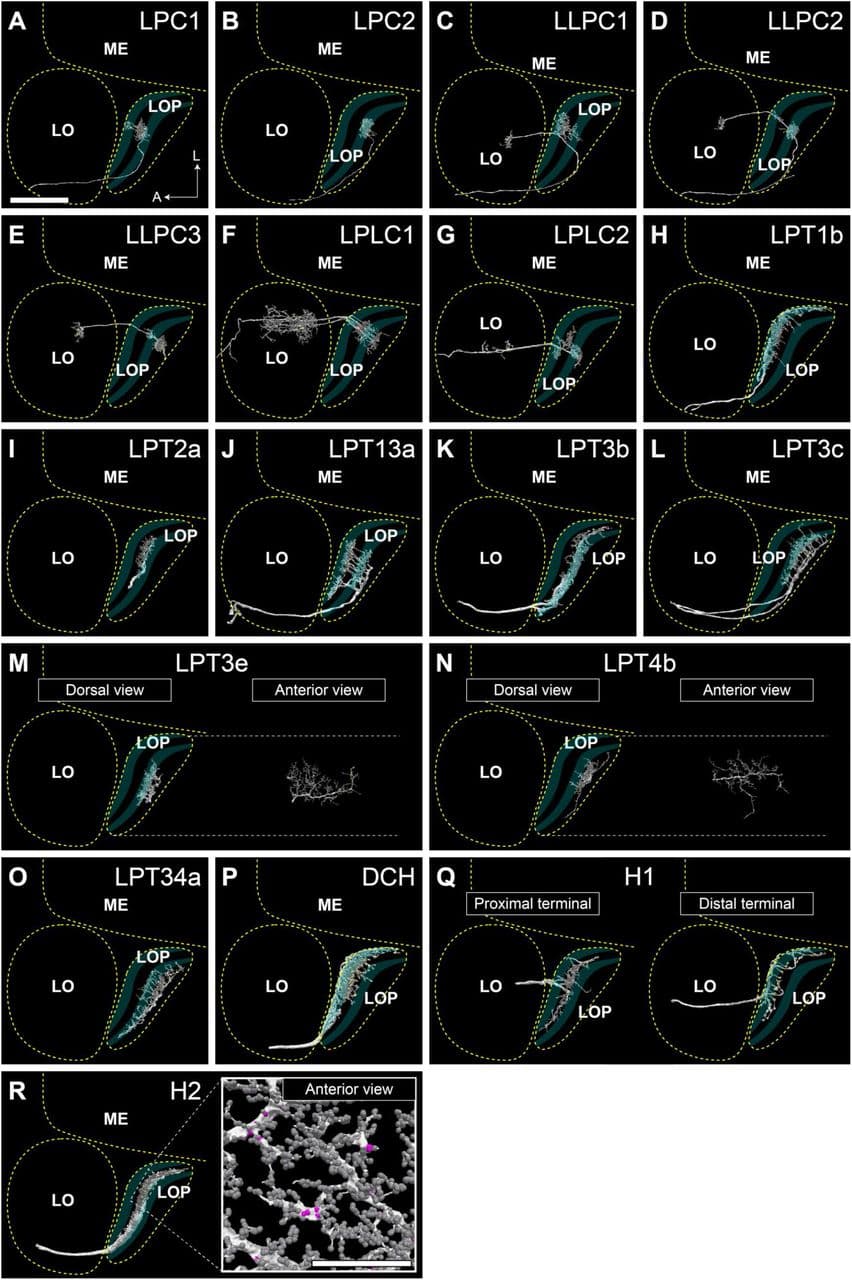
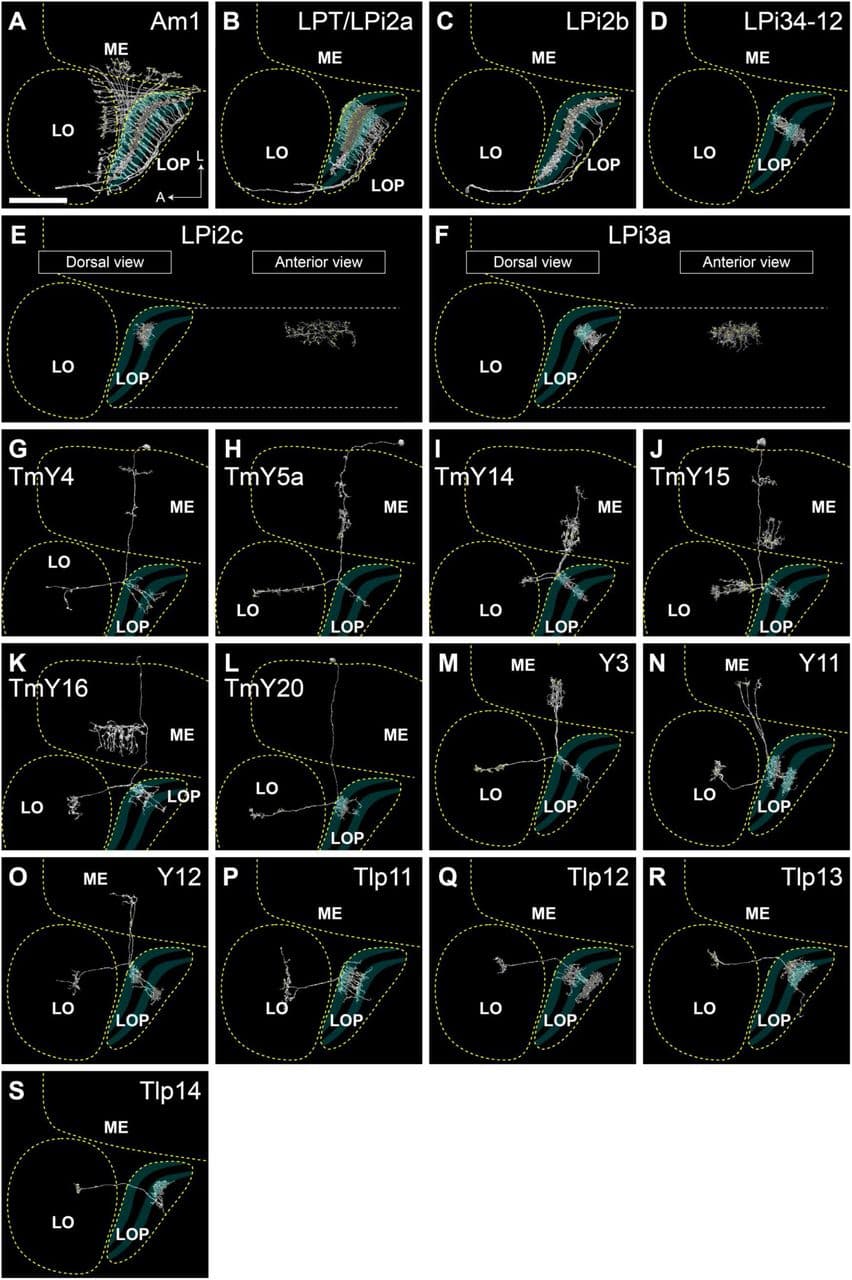
The neurons are seen from the dorsal direction (horizontal projection), the approximate neuropil boundaries are outlined, and the LOP layers are indicated. Only neurons mentioned in other figures or in the main text are shown here. Some neurons are not fully reconstructed, especially the cell body fibers and the main axons projecting to the central brain. Lobula plate-lobula columnar (LPLC) cells have cell bodies in the cell body rind between the optic lobe and central brain and dendritic arbors in the lobula that extend into the lobula plate38,40, and project to the central brain from the lobula. Lobula plate columnar (LPC) and lobula-lobula plate columnar (LLPC) cells have cell bodies in the cell body rind of the lobula plate38,40,41,43,44, and project axons along a path posterior to the lobula plate to glomeruli in the posterior lateral protocerebrum. Both LPC and LLPC send a branch into the lobula plate which, in the case of LLPC cells, further extends into the lobula. HS and VS cells are omitted from this figure (see Figure 3). In (R), the branching pattern and synapse distribution is shown in the inset. Pre- and postsynapses are shown in magenta and gray, respectively. In (A), A: anterior, L: lateral. Scale bar: (A-S) 30μm, (R) inset 20μm.
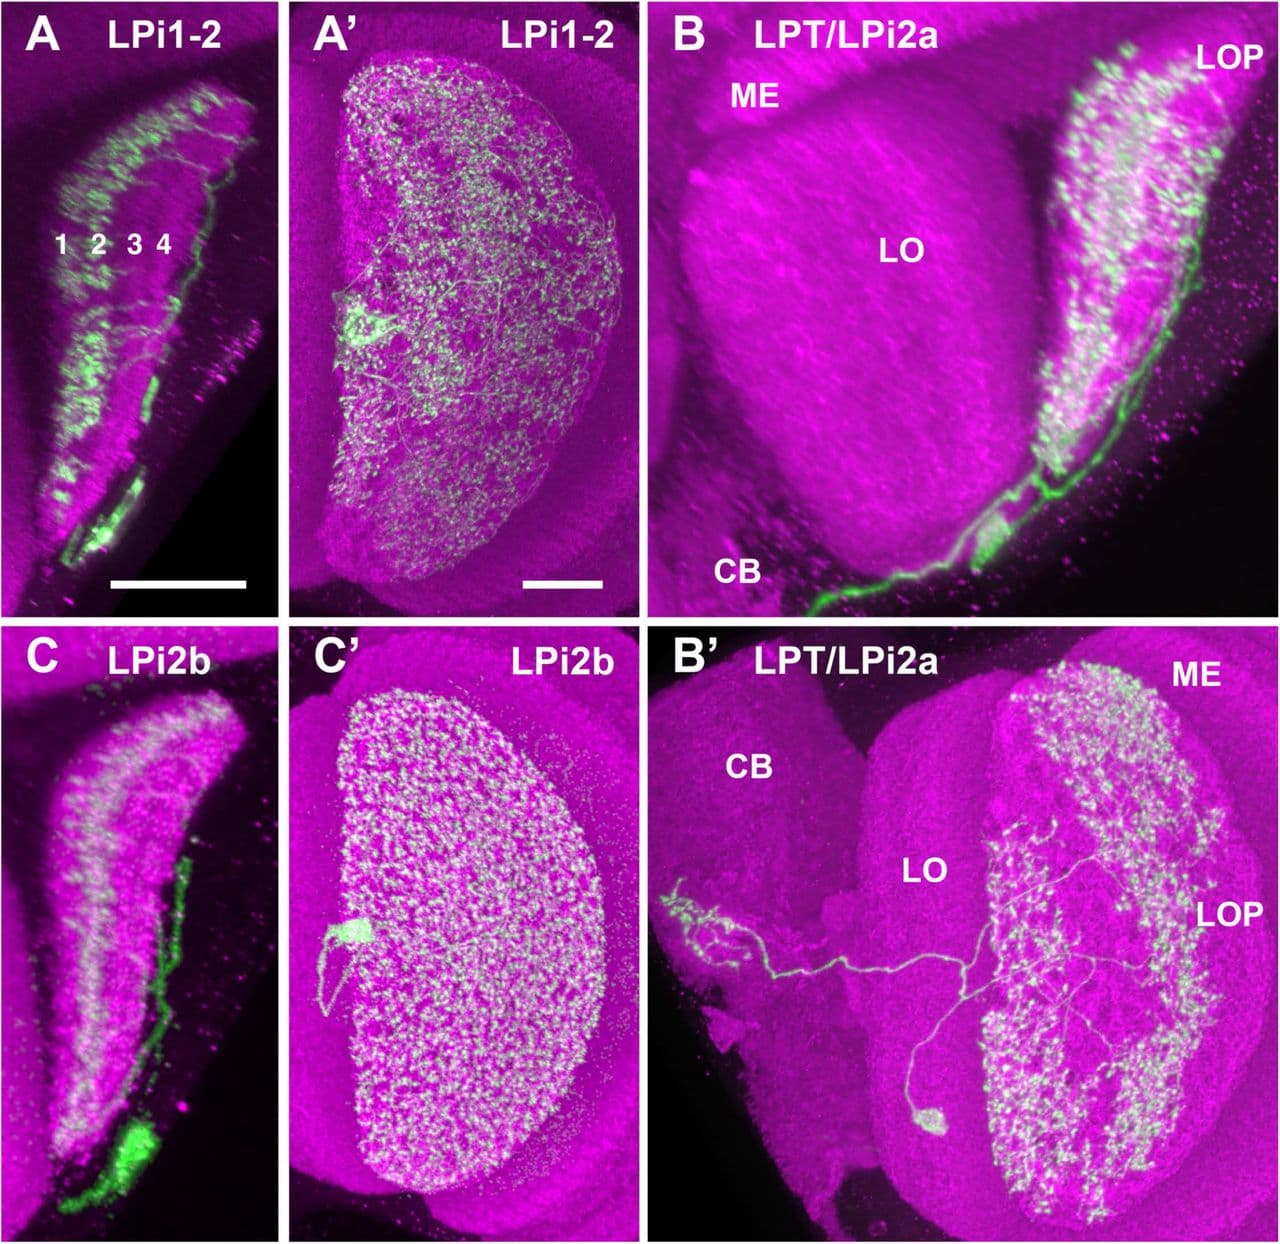
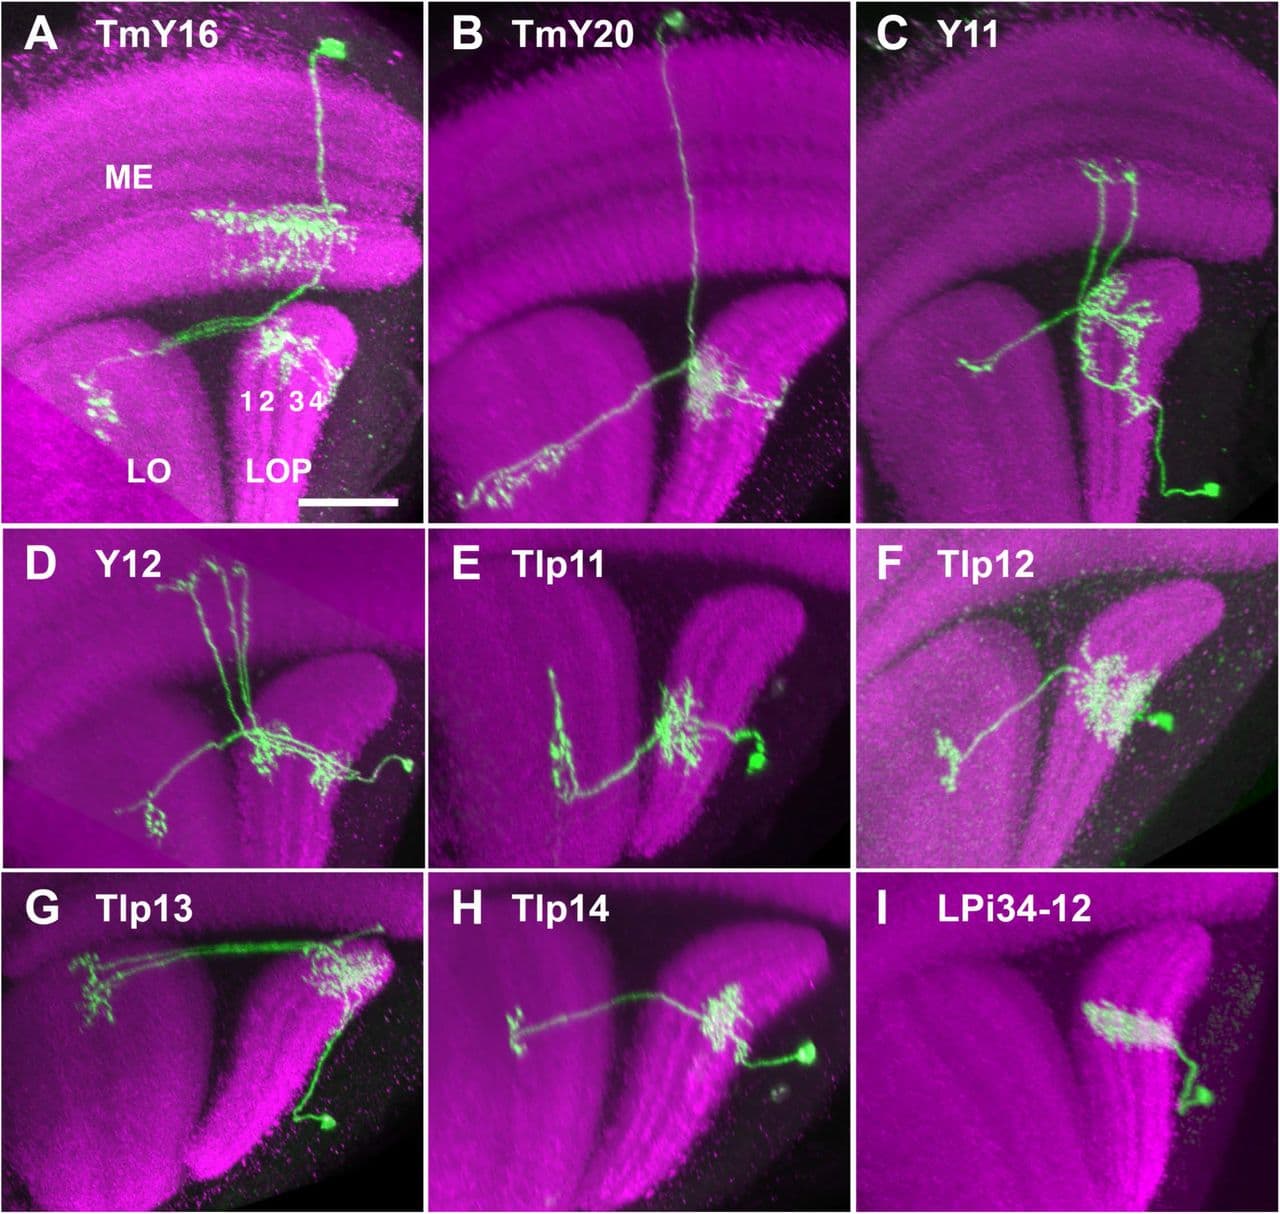
The neurons are seen from the dorsal direction (horizontal projection), the approximate neuropil boundaries are outlined, and the LOP layers are indicated. Only neurons mentioned in other figures or in the main text are shown here. Some of the neurons are not fully reconstructed, especially the cell body fibers. We confirmed the general cell shapes of all newly identified cell types shown in this figure (with the exception of the comparatively small LPi2c and LPi3a fragments) by comparison to light microscopy images (Figures S1 and S2). Based on these matches, LPT/LPi2a may be a type of VPN with a central brain projection. Pre- and postsynapses are shown in magenta and gray, respectively. Scale bar: 30μm.
Source:
Neuronal circuits integrating visual motion information in Drosophila
Kazunori Shinomiya, Aljoscha Nern, Ian A. Meinertzhagen, Stephen M. Plaza, Michael B. Reiser
bioRxiv 2021.12.20.473513; doi: https://doi.org/10.1101/2021.12.20.473513
Made these 2 from the gsheet’s info (@annkri’s pet project), mainly so that I/we don’t have to scroll through the whole tab to find what we need/want. Just download these and open them in your laptop/pc. Made only these 2 for now, as WIP, so feel free to tell me any changes you want/like and b/c the other neuron types aren’t ‘finished’ meaning there’s still sub-variants that don’t have info + pics so save me some time having to go back to the image(s) and add stuff, as each neuron type finishes (all variants have info and images) i’ll be making these if y’all like them.
Disclaimer: this isn’t an effort to belittle annkri’s or anyone else’s effort/contribution to the gsheet tab, if anything w/o it these wouldn’t even be possible, just an effort to have the info per neuron in a more individual format with larger images and so on, w/o having to scroll through the whole tab to find which ever type one may need/wanna identify/search for.
larger file/quality link:
@Nseraf Very nice…awesome idea! I may print these out and hang a few on the wall, next to my screens. ![]()
I love these! The sheet’s great for a quick ID but sometimes I want an up close look at a cluster’s morphology. IMO the more visual resources we have the better.
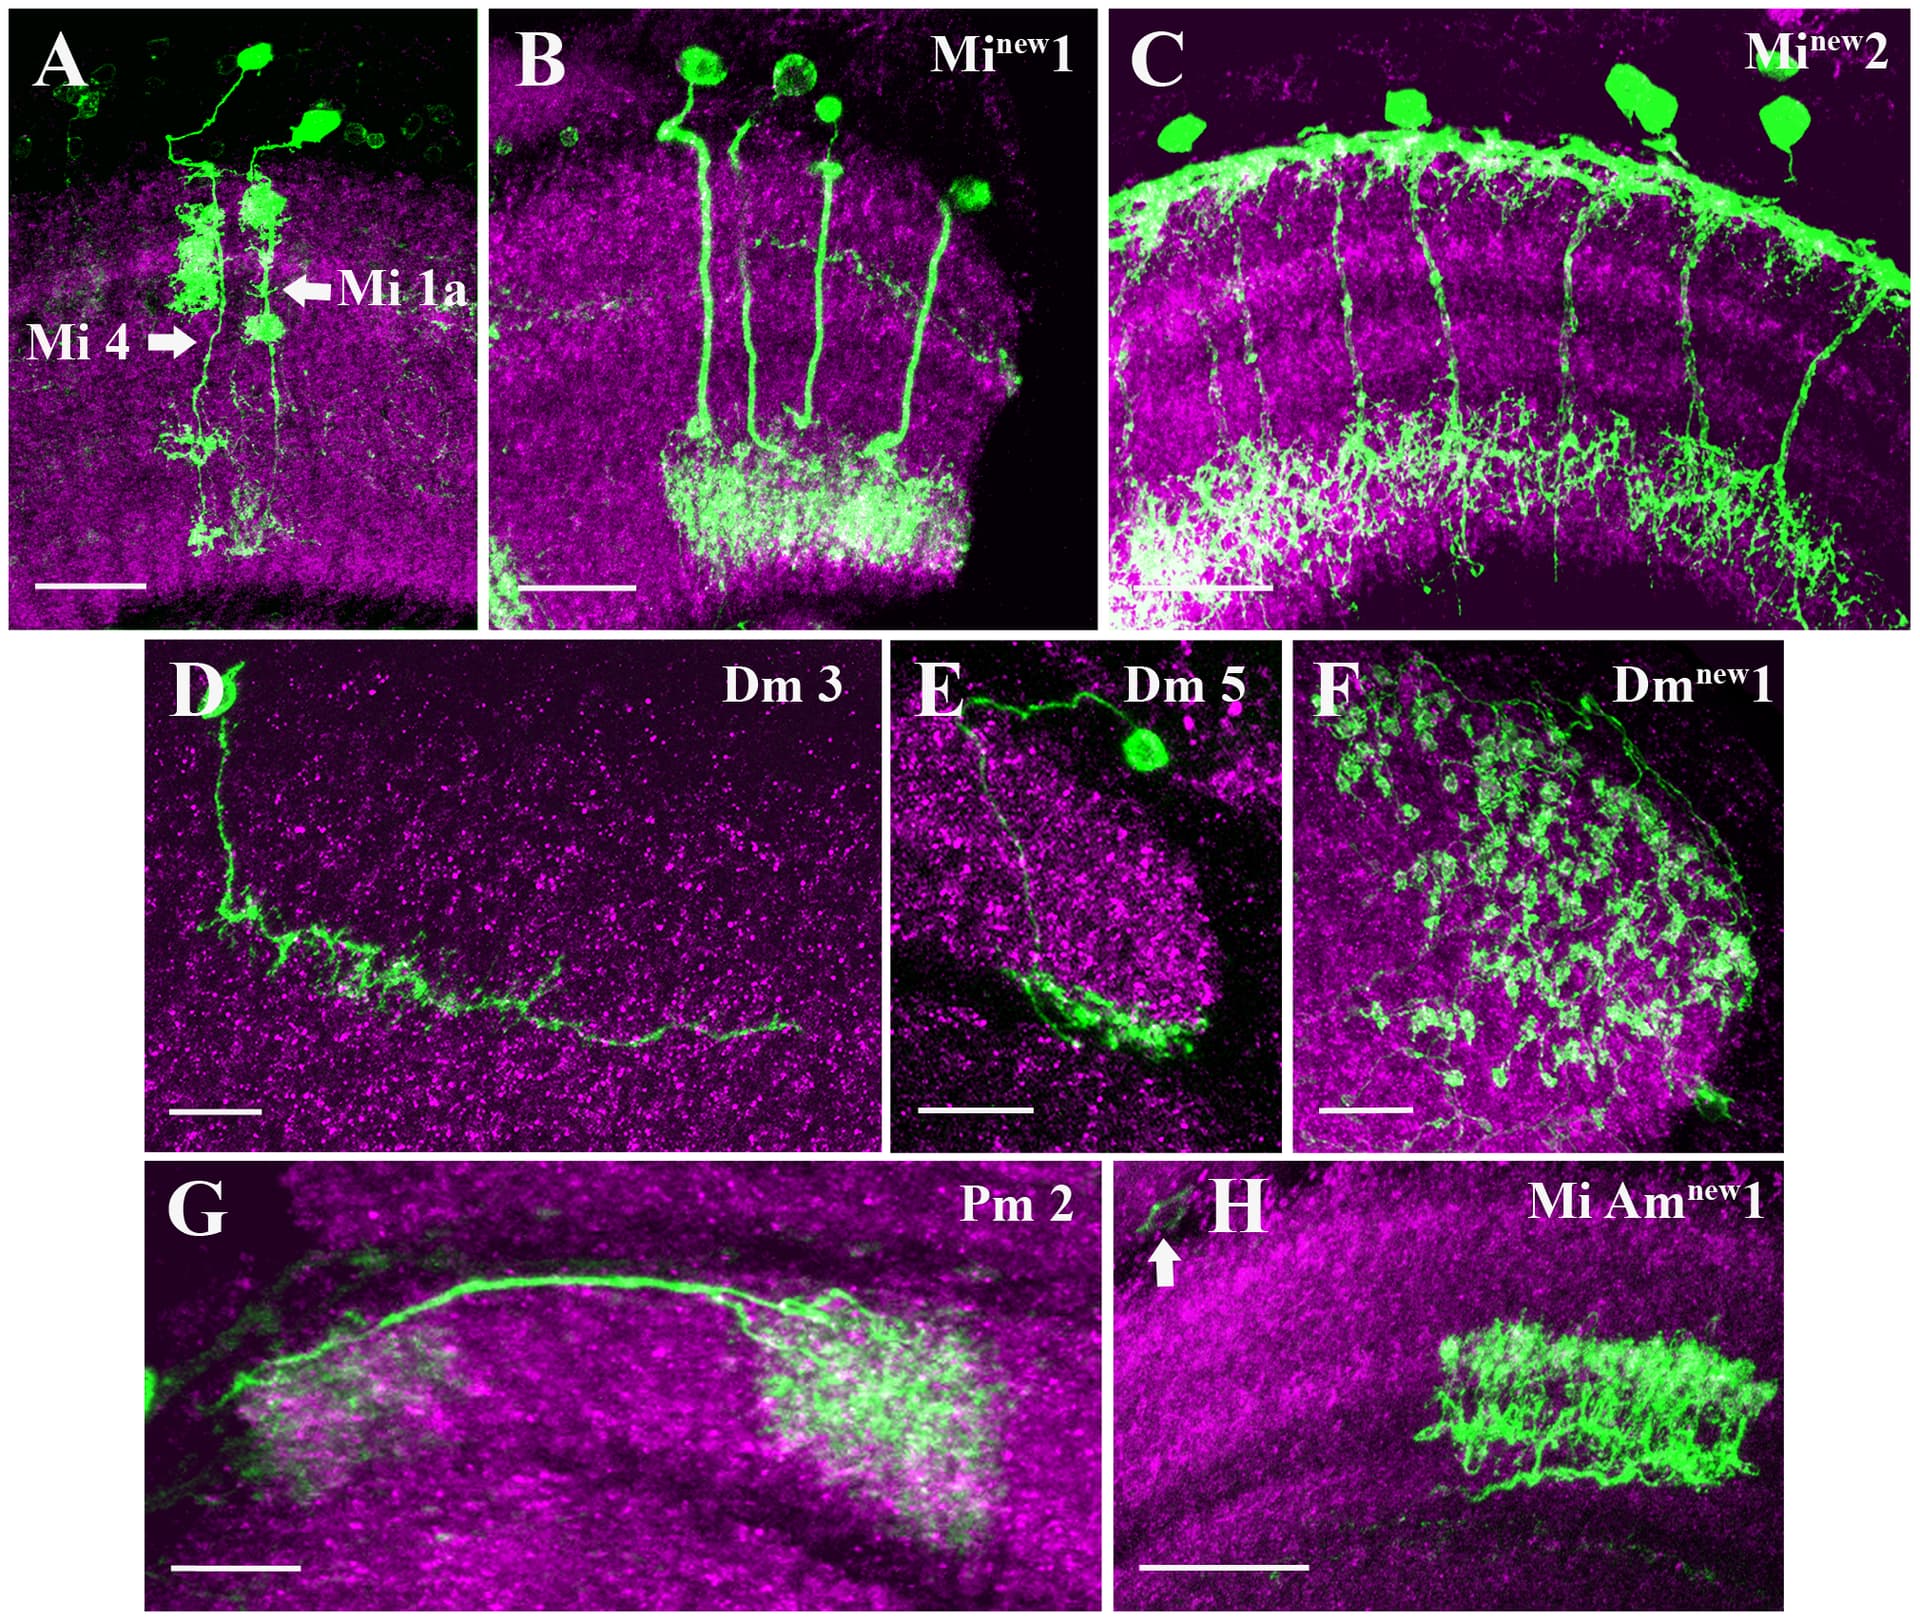
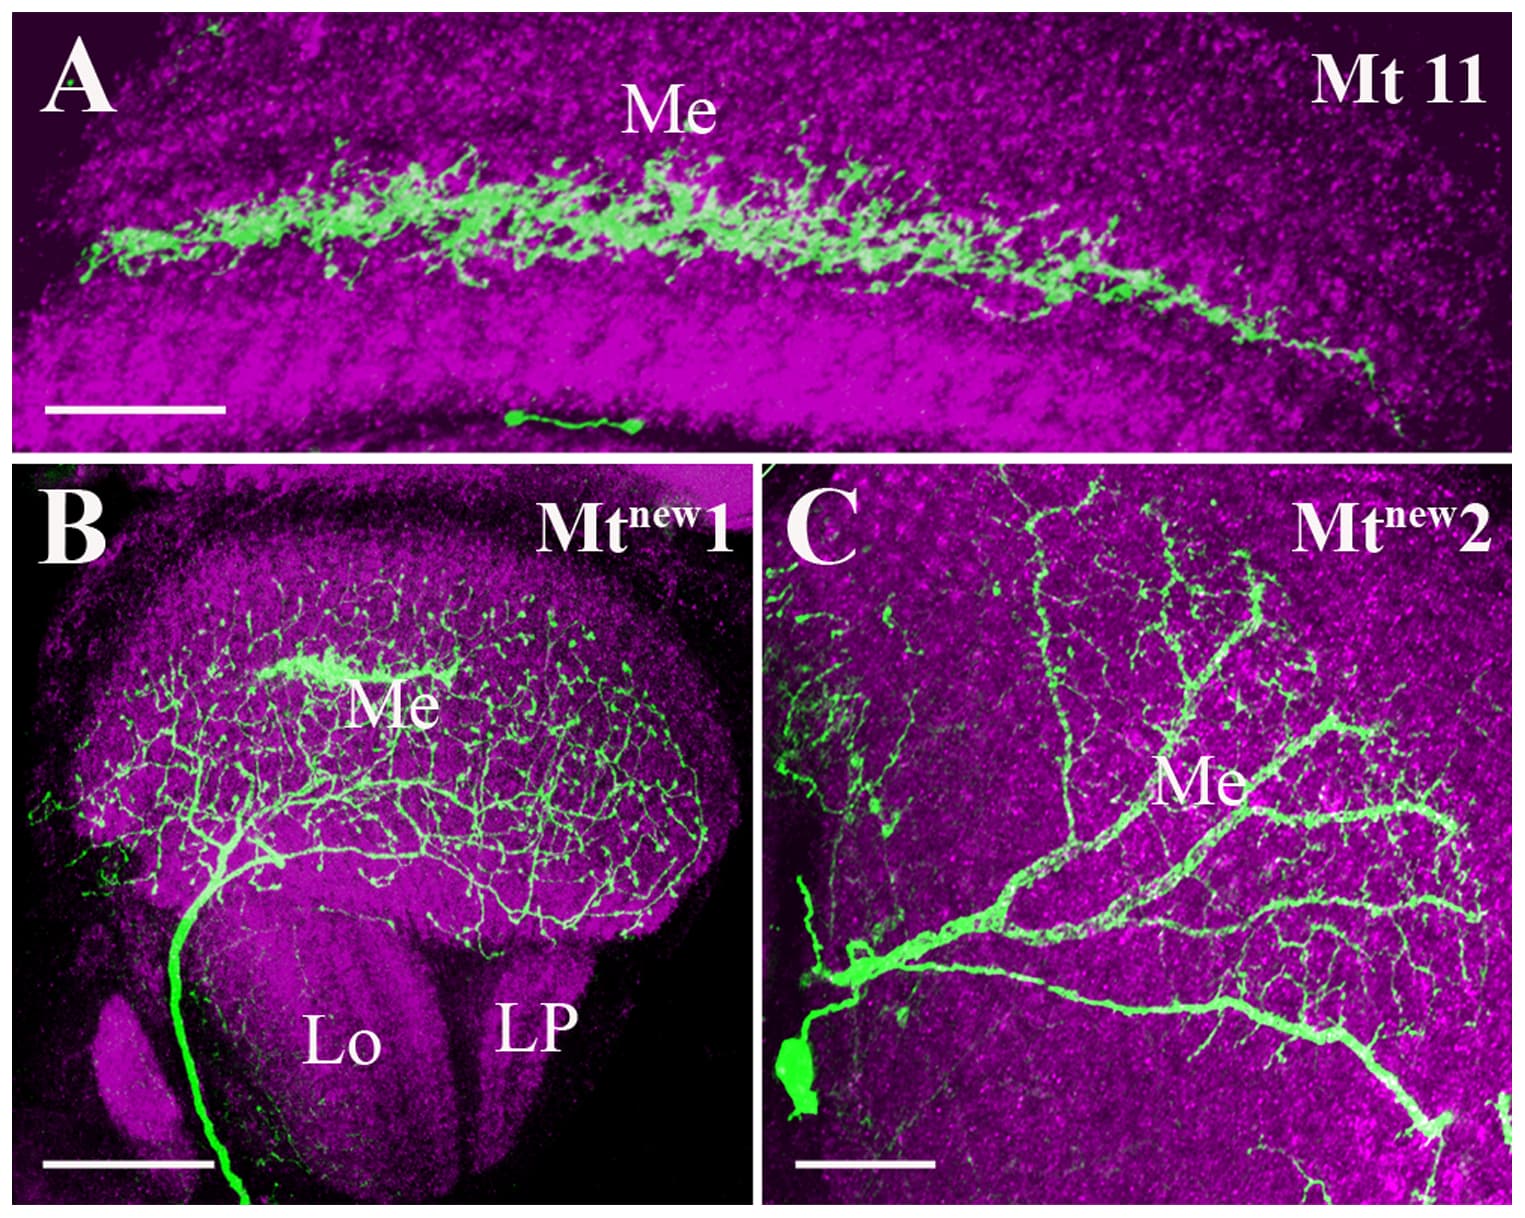
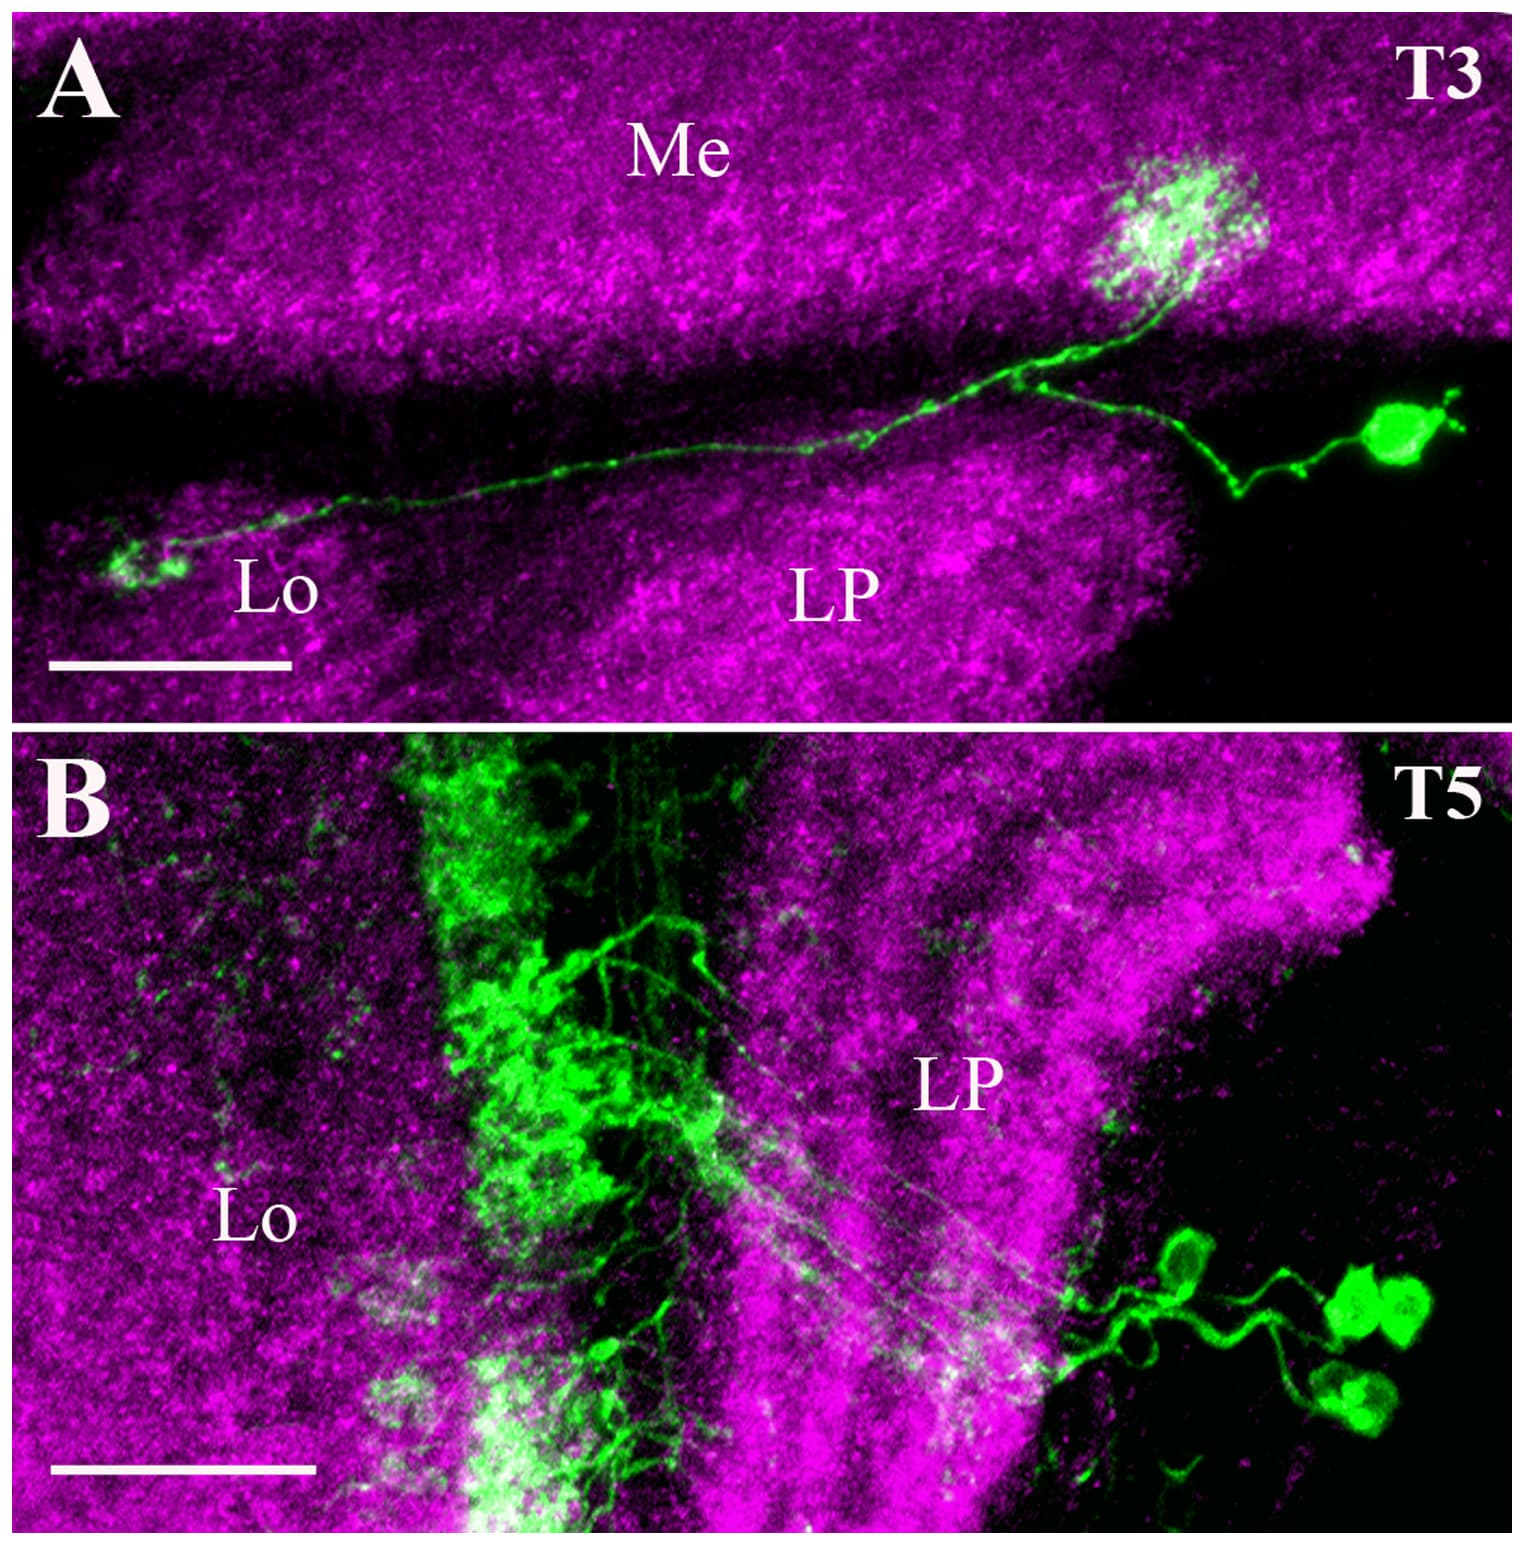
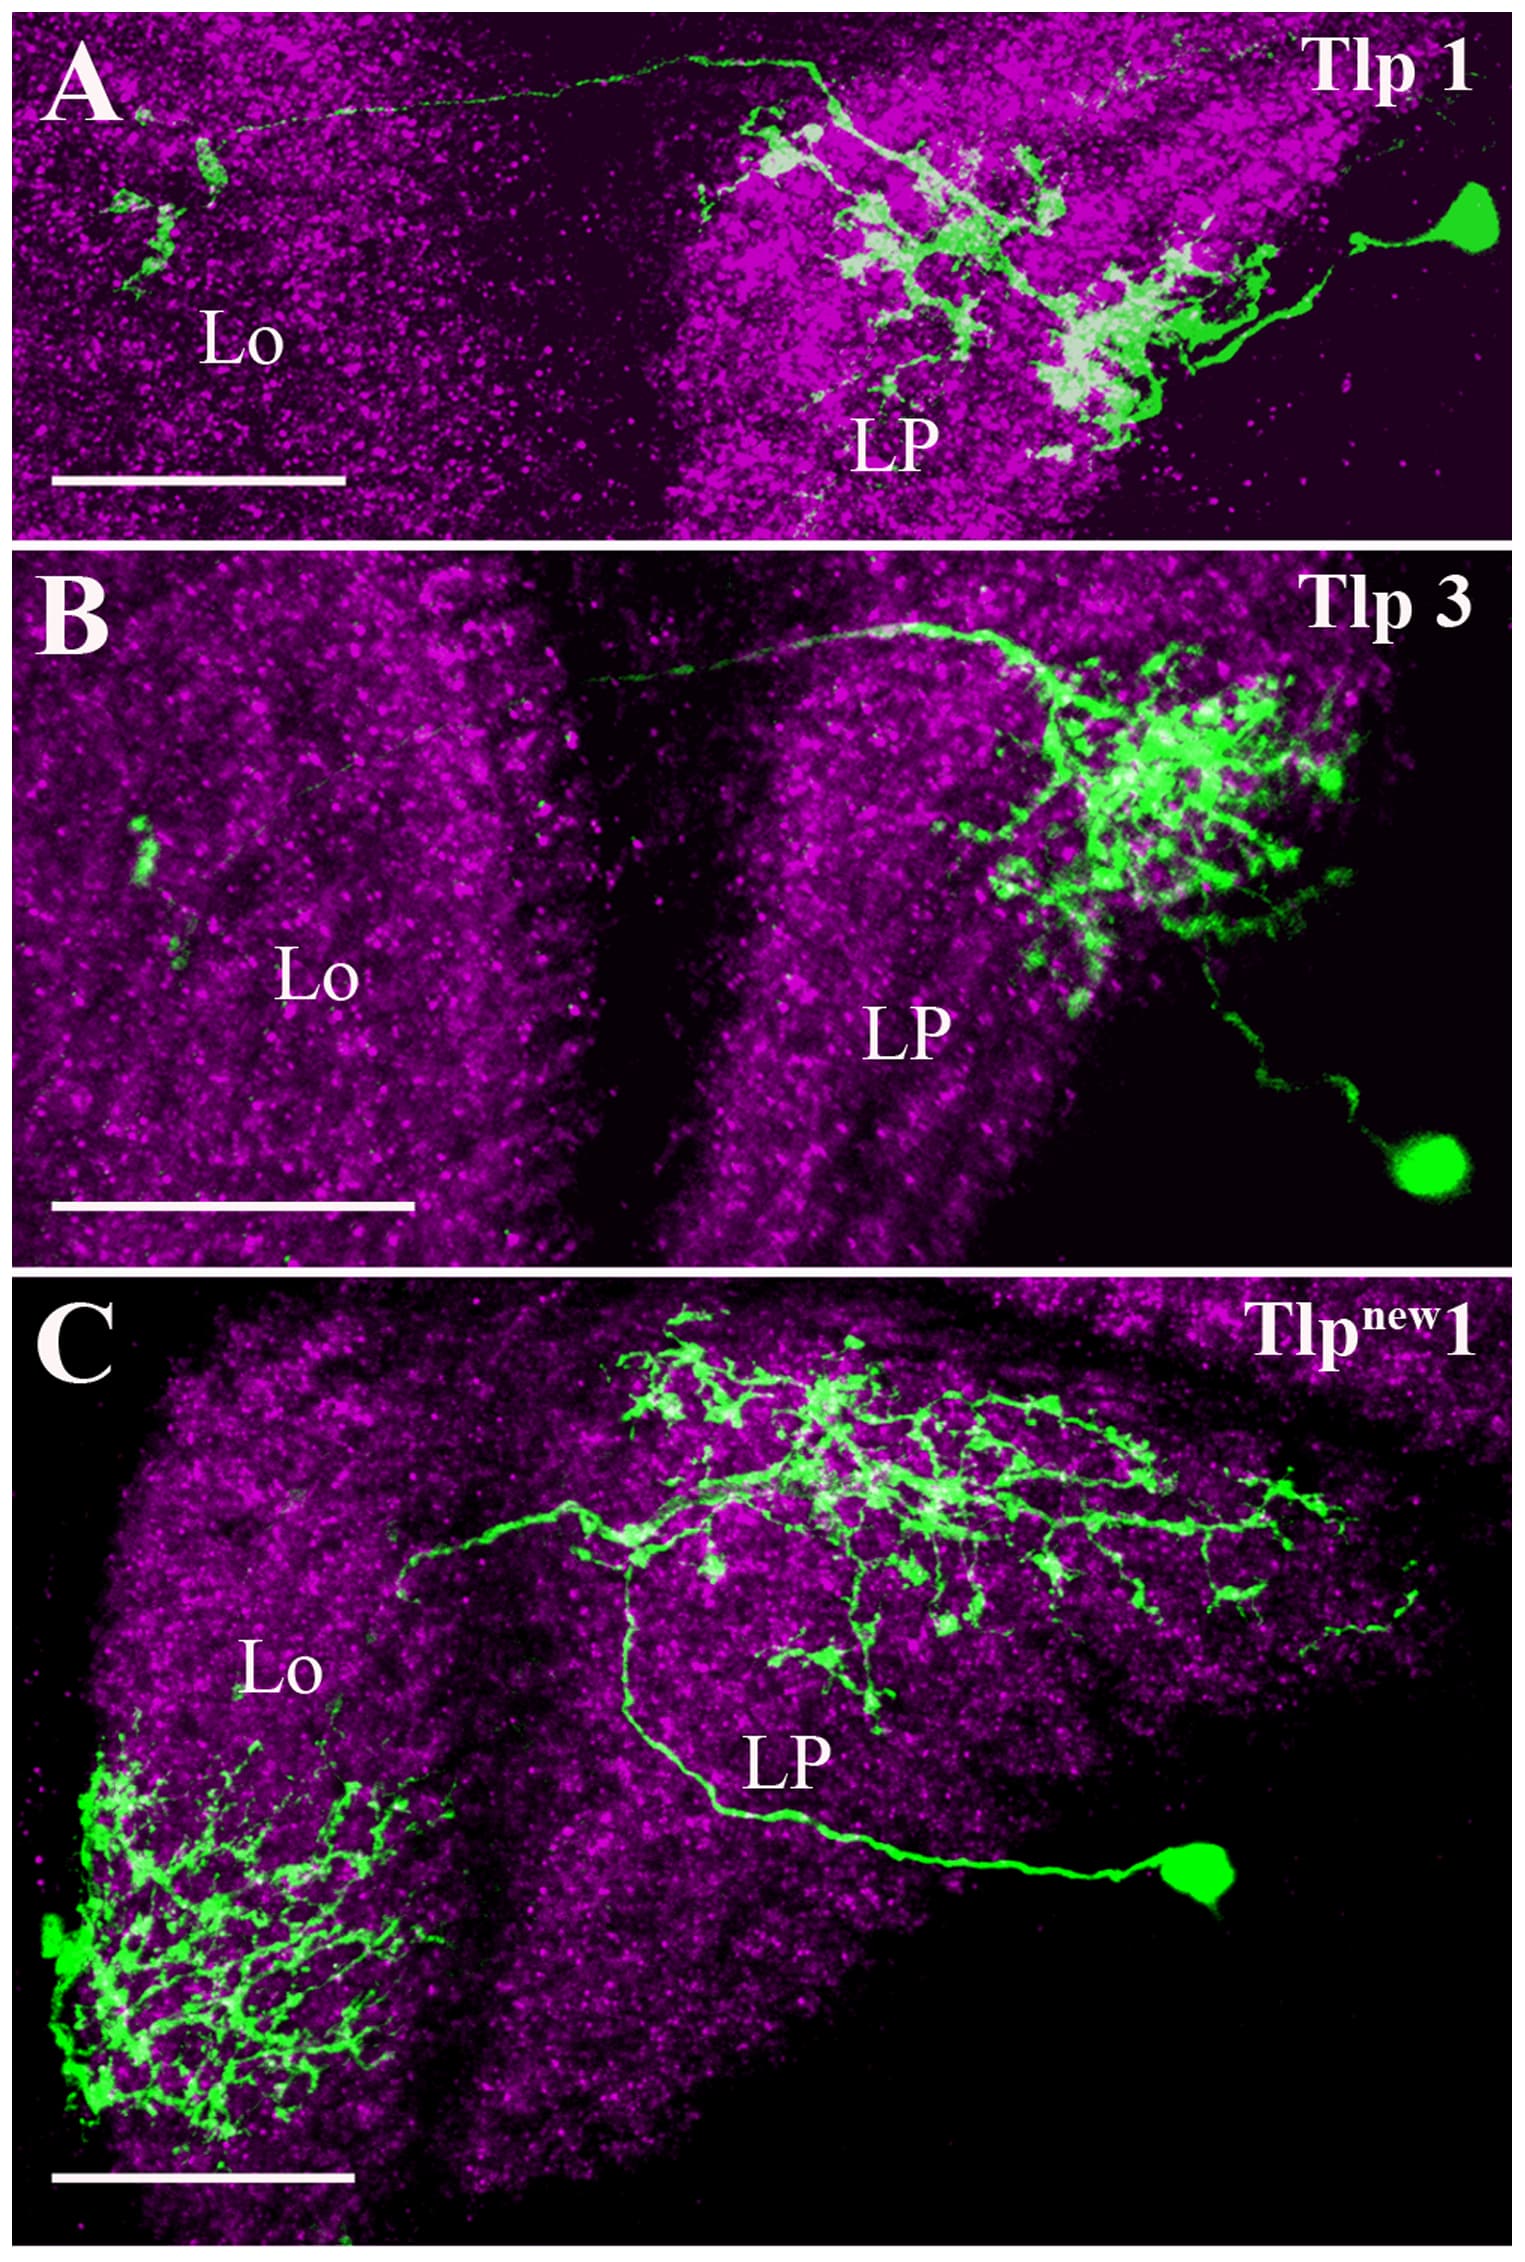
Ended up on another image hunt. Enjoy.
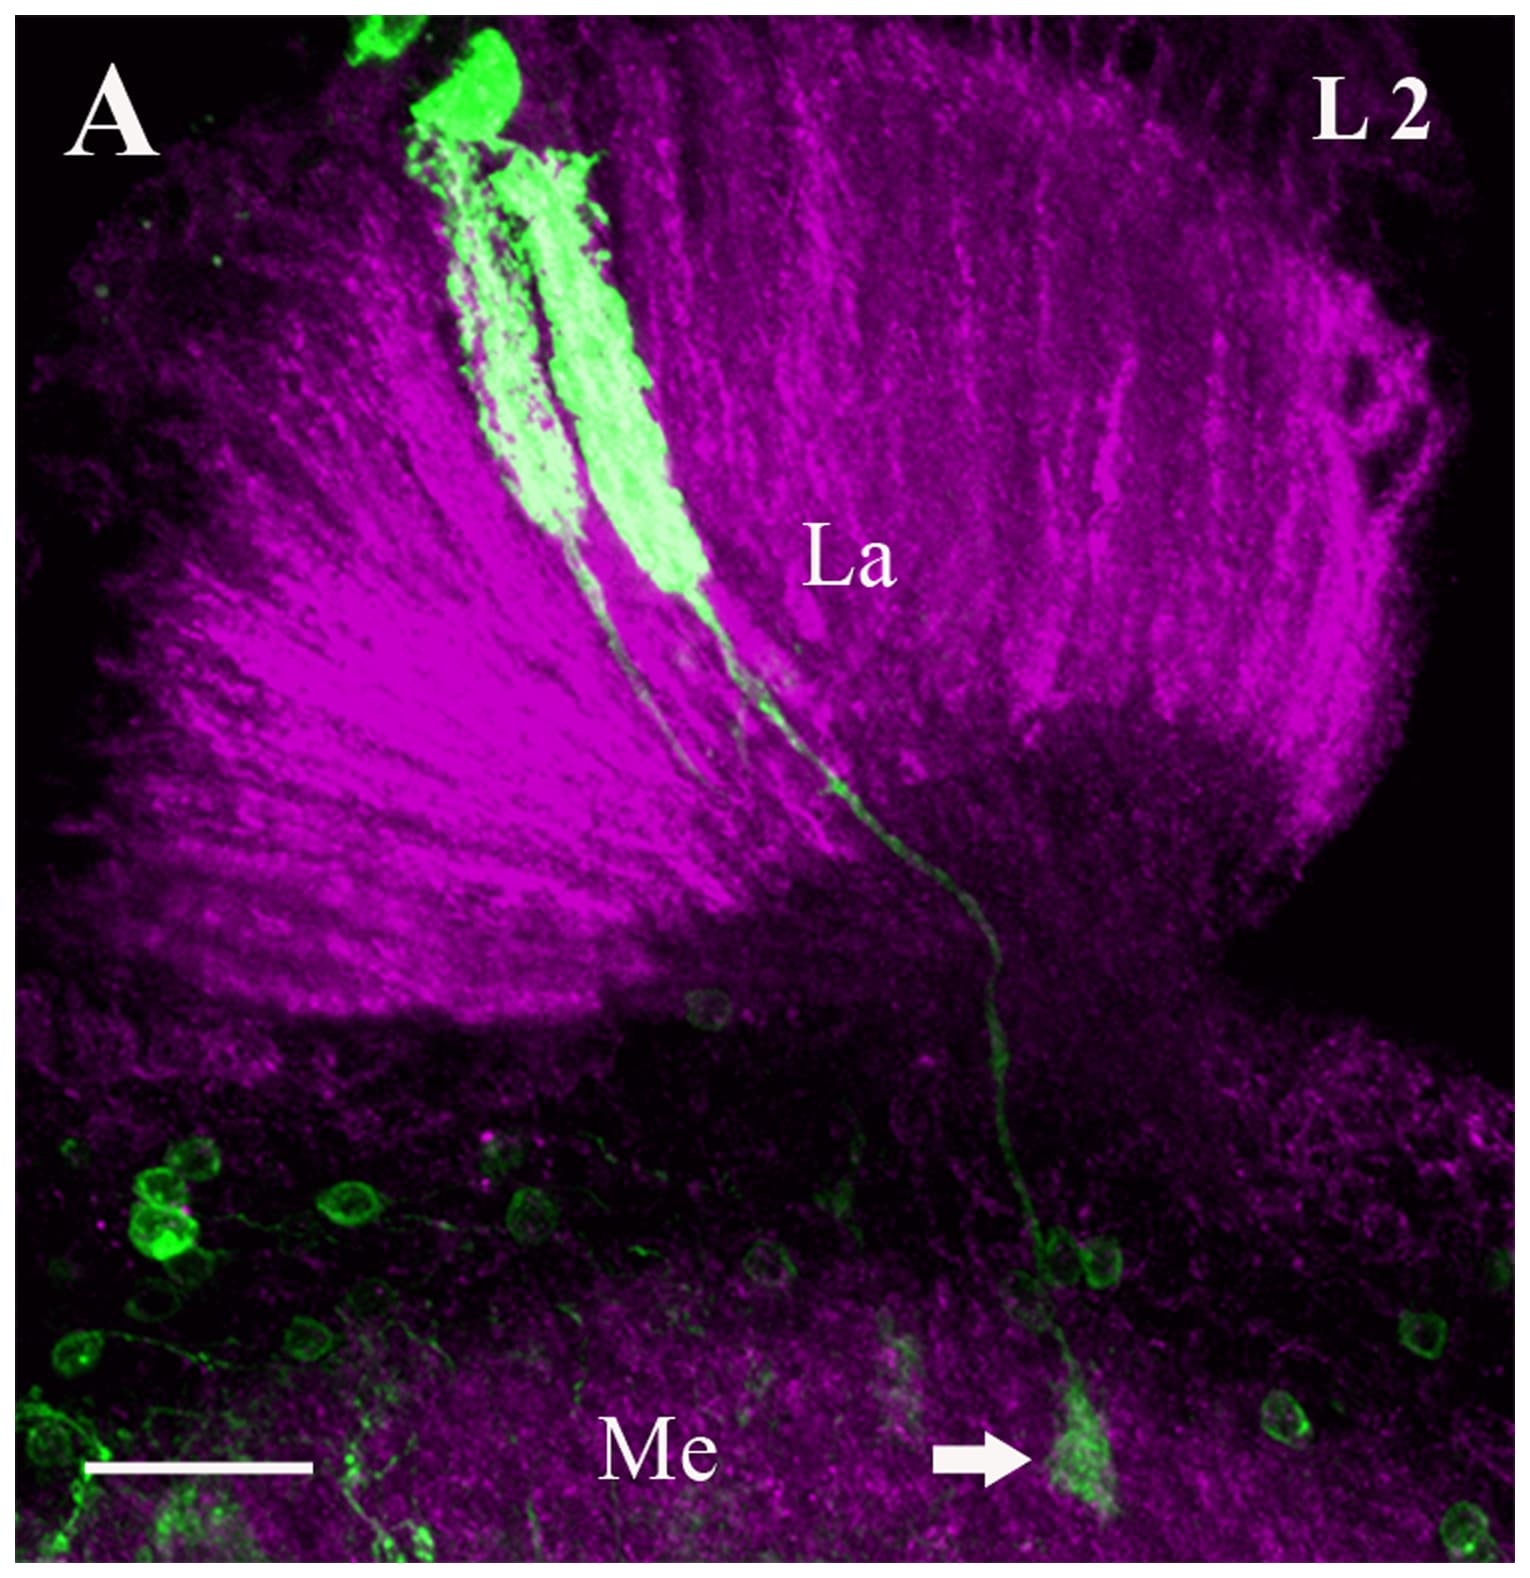
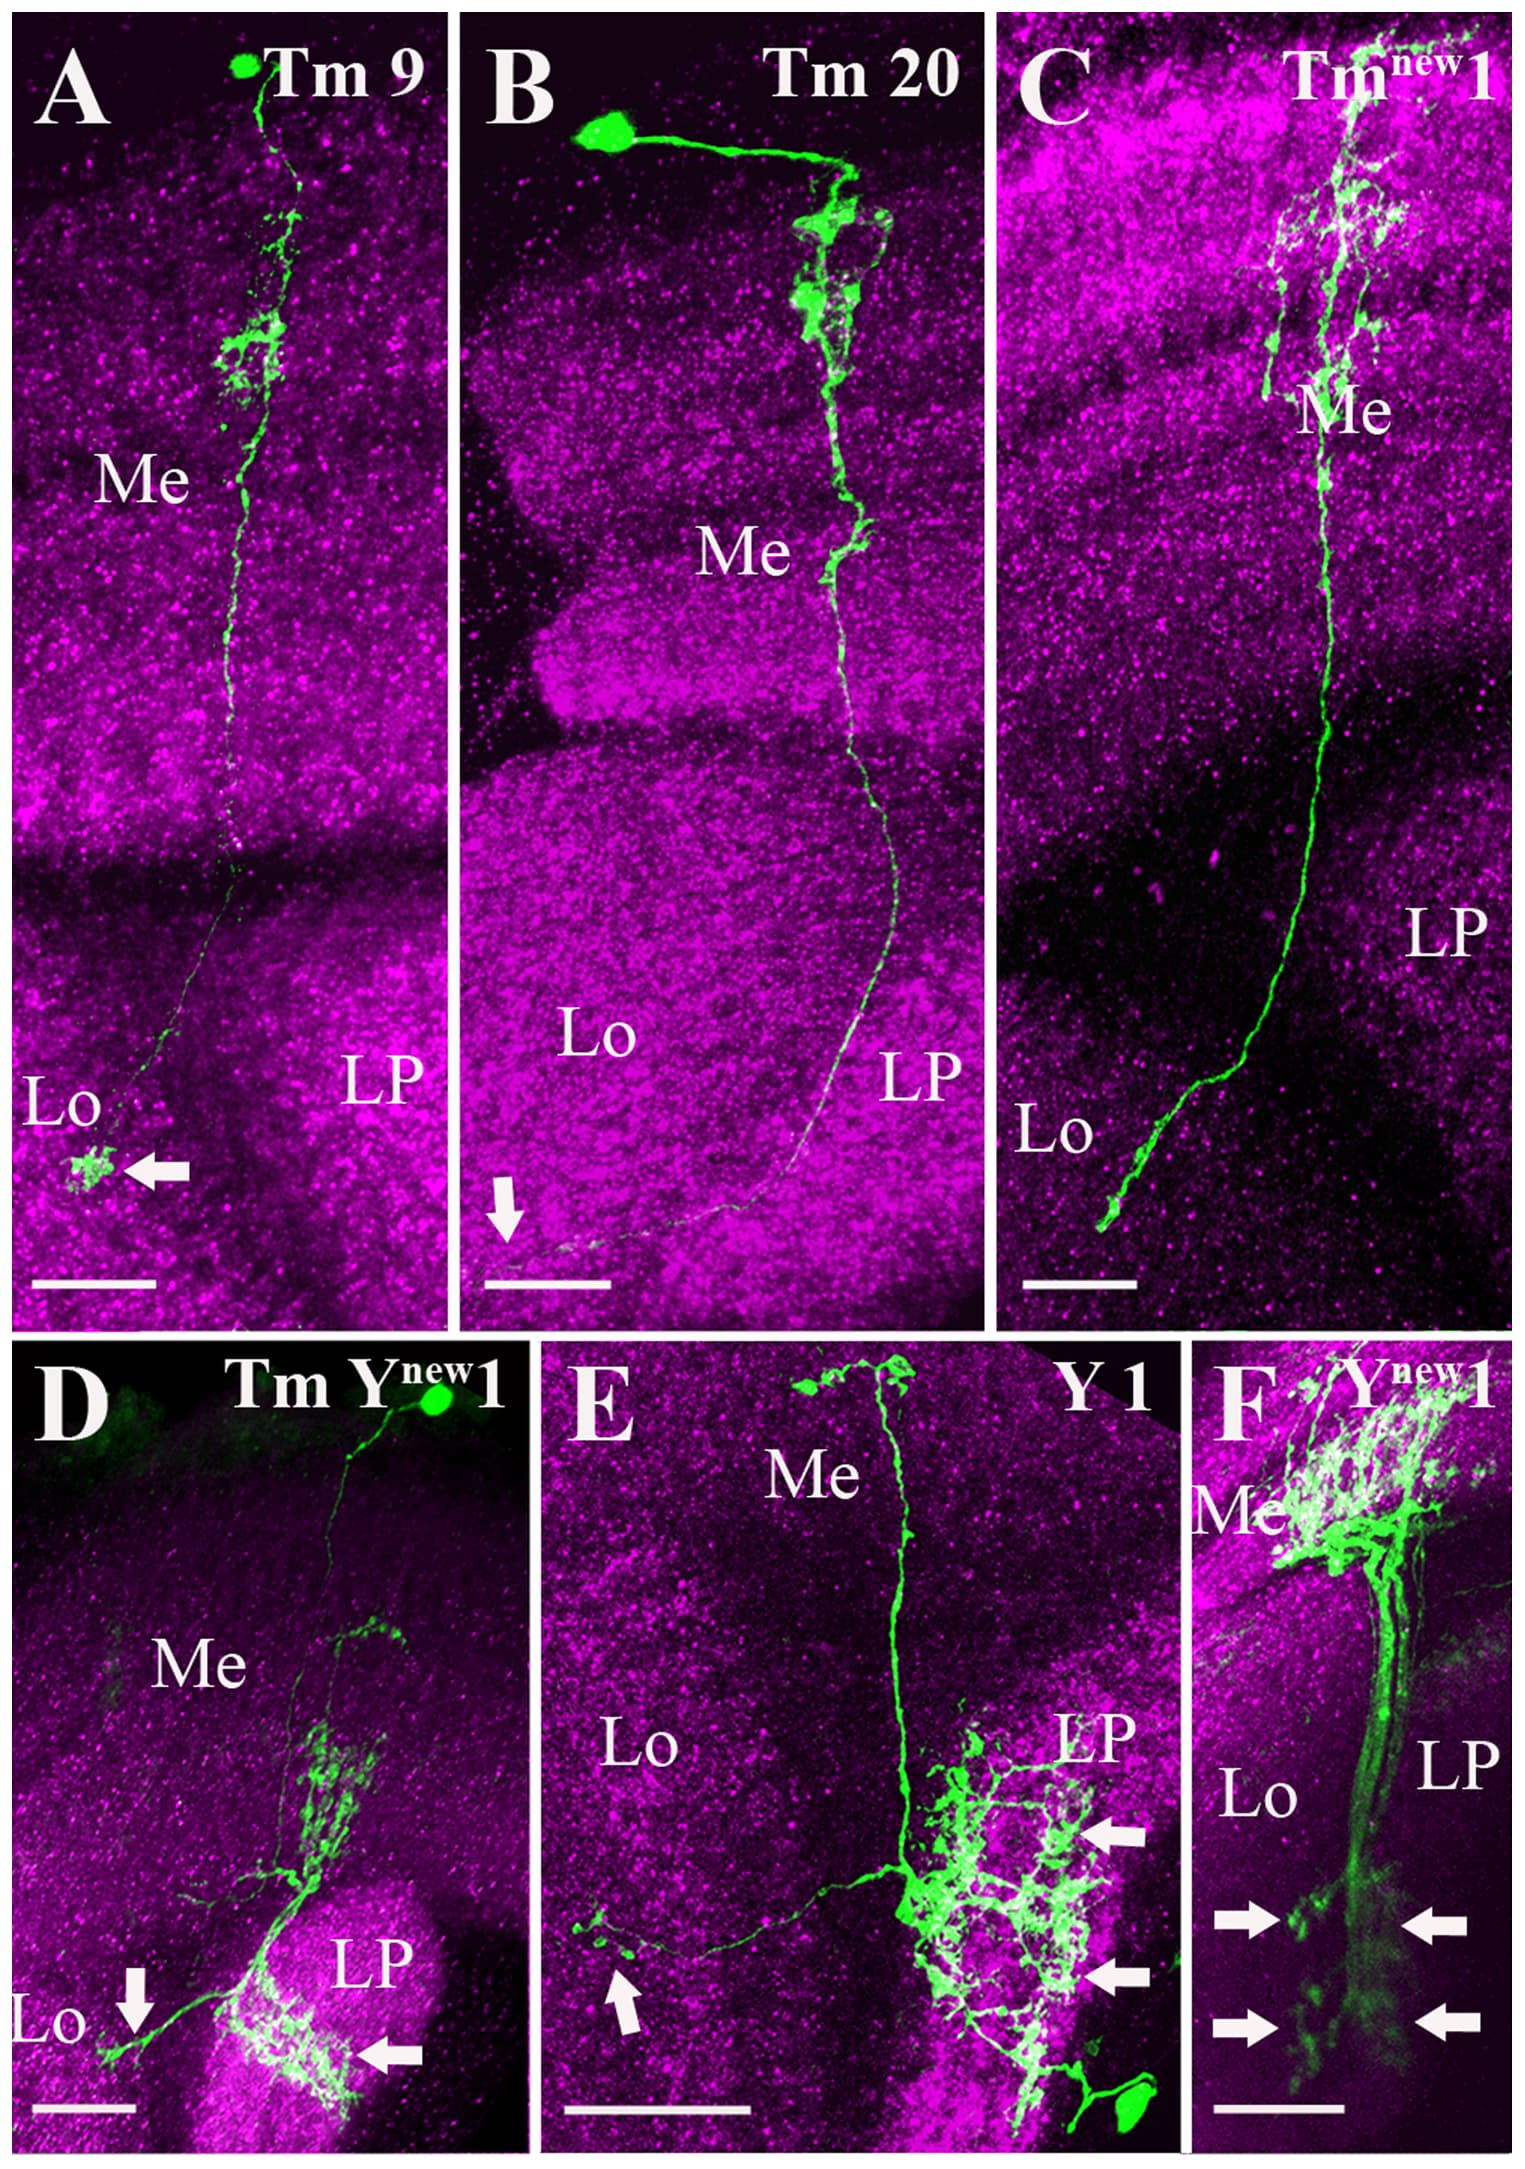
Tm9, Tm20, Tm(new)1, TmY(new)1, Y1, Y(new)1
A lot of visualizations. (Source)
Great idea, with only one screen i would also like to print out this.
I have been thinking on how it would be possible to make pictures that would look good in 2d showing the placement of the cell in the optic lobe, but have not really found a good solution yet. My current idea is to add all the different cells of one type together and use the Neuropils layer (only the ones where that cell type is) thinking it would be more informative than the brain mesh, and maybe also add a label to each cell. But probably a great idea to have this at the top of your info sheets to quickly see if you are in the right region looking. kind of like we are using the fishback paper now, but with actual cells instead of illustrations.
I am also thinking it would be great to use several columns on the cell types with several undertypes, to make it close to a4 size to make it paper friendly ofc the biggest groups would probably need several sheets.
that sounds like a great idea, lemme know if I can do/help anything w either 3D or 2D (photoshop etc).
I found some info about LC (Lobula columnar) cells:
Useful images from the article:
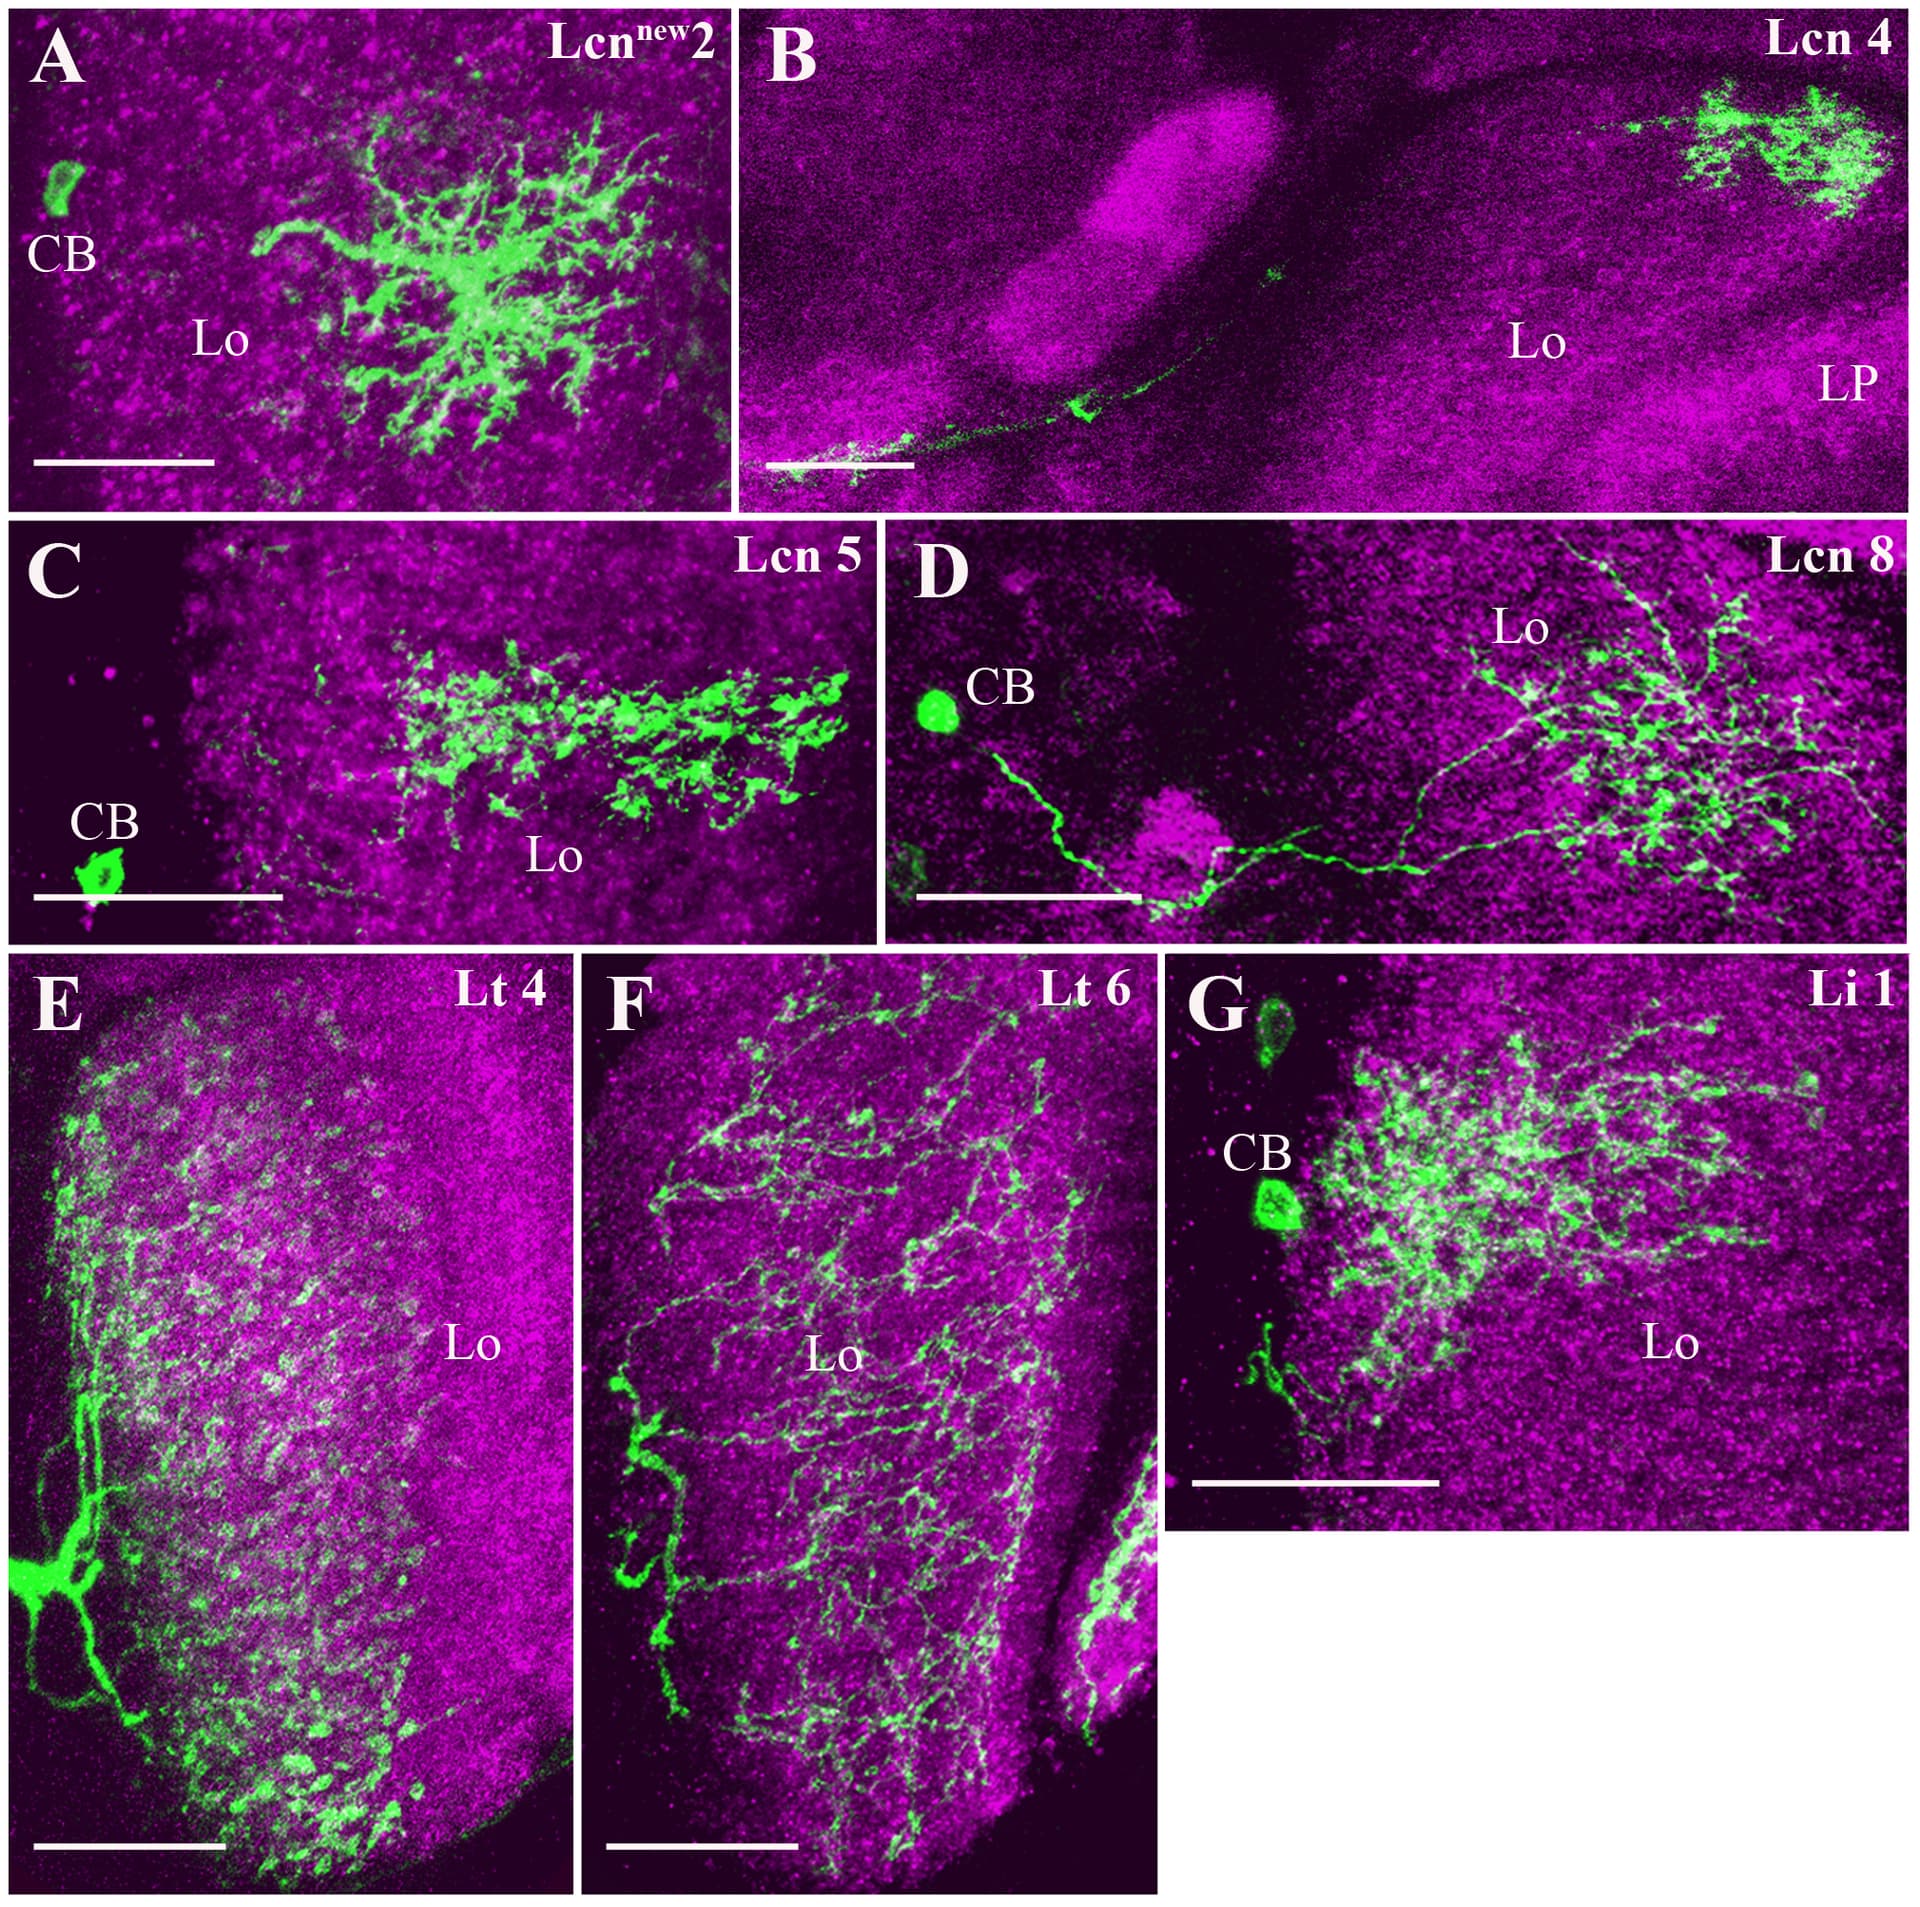
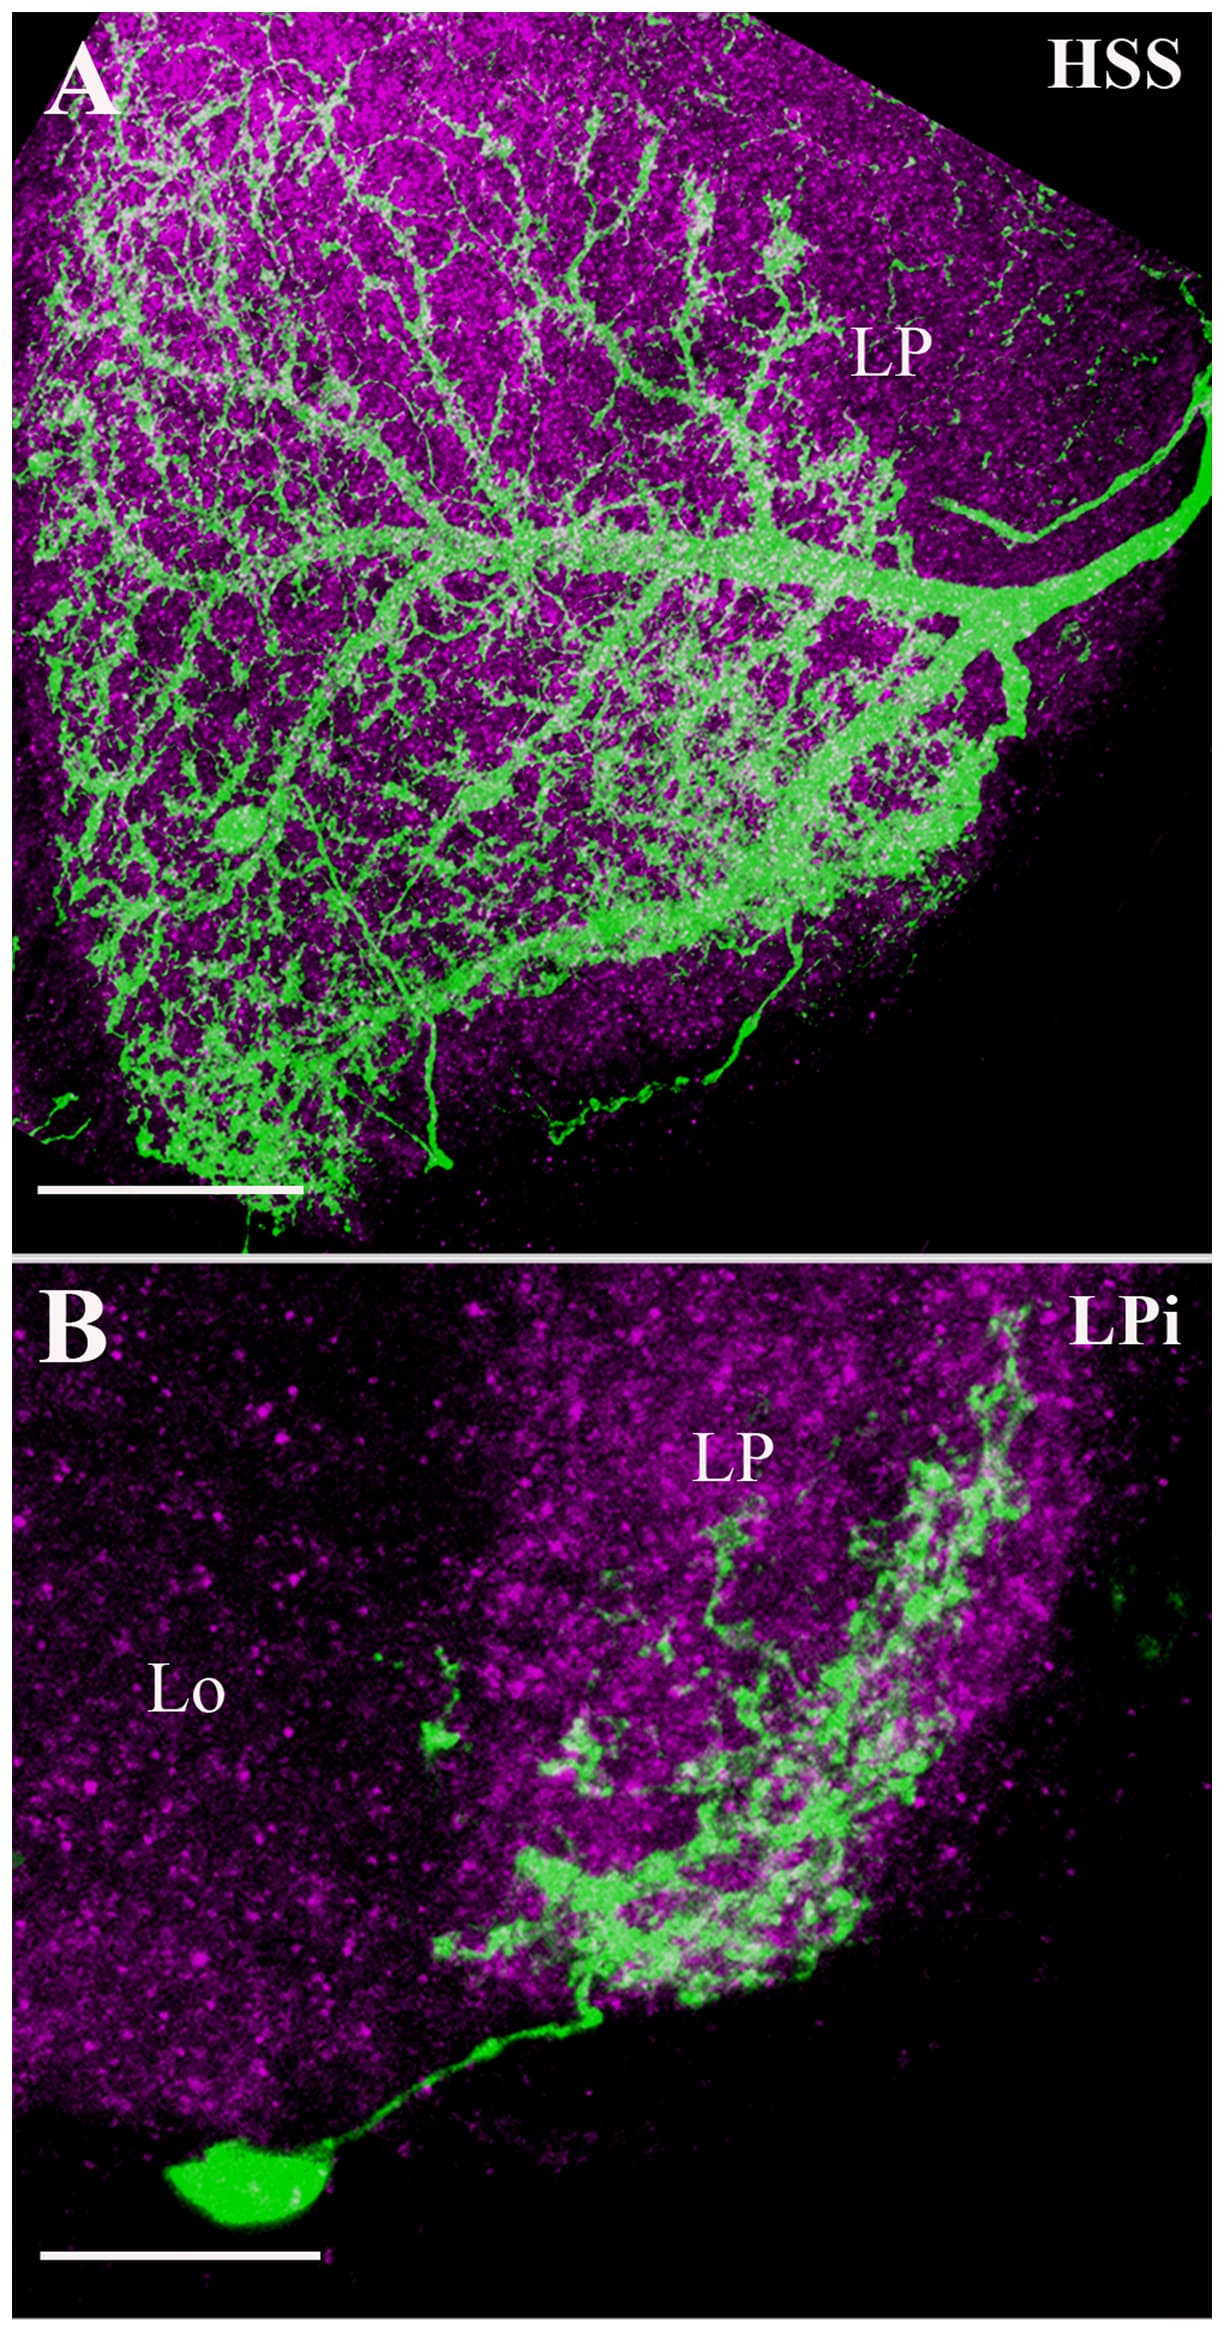
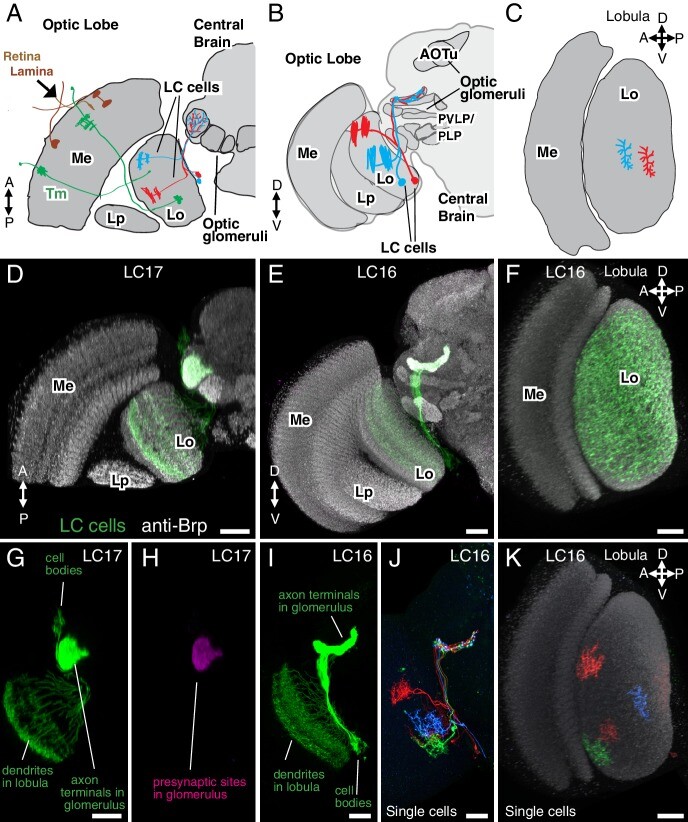
Introduction to lobula columnar (LC) neurons.
Schematics (A–C) and confocal images (D–K) show the lobula and adjacent parts of the visual system. (A,D,G,H) Horizontal sections. (B,E,I,J) Anterior views. (C,F,K) Cross-section views of the lobula. Some subregions of the optic lobe (Me, Medulla; Lp, Lobula plate; Lo, Lobula) and central brain (AOTu, Anterior Optic Tubercle; PVLP, Posterior Ventrolateral Protocerebrum; PLP, Posterior Lateral Protocerebrum) are indicated in selected panels. Dendrites of individual LC neurons (red and blue cells in the schematics and red, blue and green cells in J,K) span only part of the visual field. As populations, the neurons of a given LC cell type cover most or all of the lobula (F), though LC neurons with regionally restricted lobula arbors also exist (e.g. LC14 (Otsuna and Ito, 2006), see Figure 1—figure supplement 1). LC neurons receive feed forward visual inputs from photoreceptors in the retina via a series of optic lobe interneurons (a few lamina neurons, in brown, and transmedullary neurons [Tm], in green, are illustrated as examples in [A]). This places LC neurons at least 2–3 synapses downstream of the photoreceptors. The majority of LC neurons projects to distinct target regions in the central brain called optic glomeruli; some of these are illustrated in (A) and (B) and also visible as distinct structures in the anti-Brp pattern in the images in (D) and (E). Most optic glomeruli are located in the PVLP and the adjacent more posterior PLP. The more dorsal AOTu (illustrated in [B]) is considered a specialized optic glomerulus. For a more detailed map of optic glomeruli see Figure 3. Confocal images show either populations of neurons (D–I) or individual cells labeled using Multicolor FlpOut (MCFO) (Nern et al., 2015) (J,K). LC cell types shown are LC17 (D,G,H) and LC16 (E,F,I–K). Population labeling (D–I) was with split-GAL4 driven expression of a membrane marker (green; myr::smFLAG, using pJFRC225-5XUAS-IVS-myr::smFLAG in VK00005) with a presynaptic marker also shown [magenta; synaptotagmin-HA, using pJFRC51-3XUAS-IVS-syt::smHA in su(Hw)attP1] in (D,E) and by itself in (H). A neuropil marker (anti-Brp) is included in grey in (D–F,K) and neuropil regions are also in grey in the schematics. Images in (D,E,G–J) were generated using brains that were computationally aligned to a template brain using the anti-Brp pattern as reference. The anti-Brp pattern in (D,E) is that of the standard brain used for alignment. Images in (D–K) show projection images of different views of three-dimensional image stacks; these were generated in either Fiji (http://fiji.sc/) (D,E,G–J) or Vaa3D (Peng et al., 2010) (F,K). Scale bars represent 20 µm.
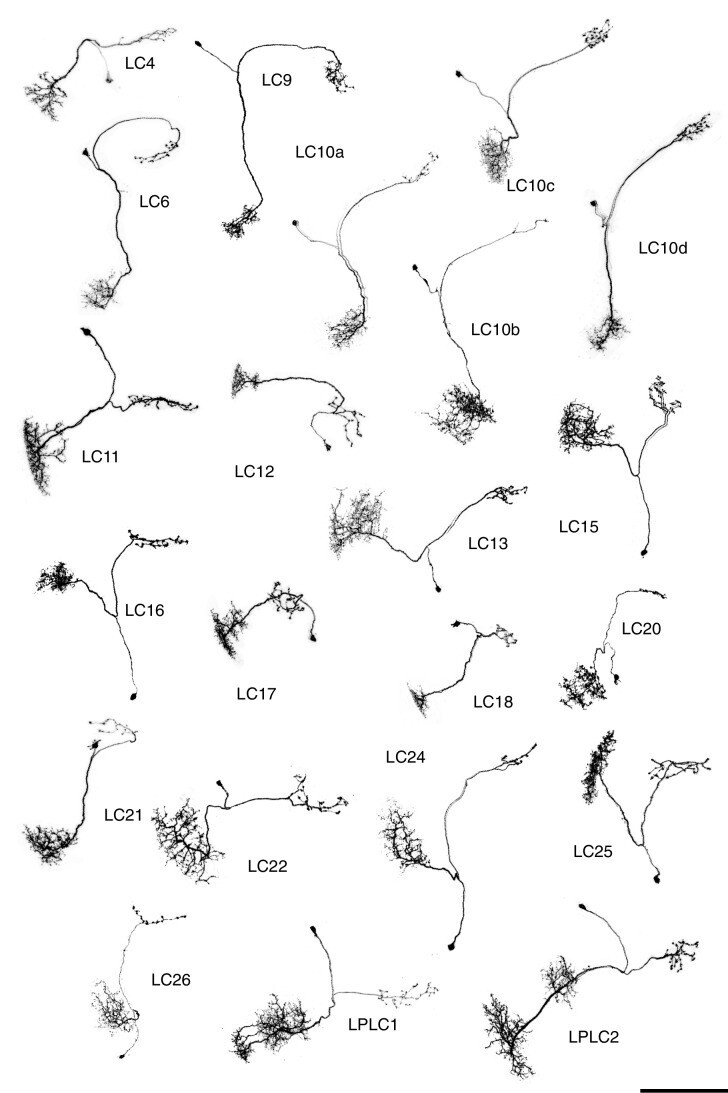
Images are reoriented views (generated using Vaa3D) of MCFO labeled LC neurons. Anti-Brp neuropil marker is in grey. For each cell type, two different views, along the AP and along the DV axes of the lobula, respectively, are shown. The two panels for a cell type can either show the same specimen in two views or two different specimens. Scale bars in the LC4 panels represent 20 µm; images of other cell types are shown at very similar scale.
Source: https://www.ncbi.nlm.nih.gov/pmc/articles/PMC5293491/
Other names for some neurons:
Lcn - lobular columnar neuron (Fischbach)
LCN - as above
LC - lobular columnar
Lccn - lobula complex columnar neuron (Fischbach)
LPLC - lobula plate-lobula columnar
LPL - lobula plate-lobula neuron
Lpt - lobula plate tangential (Fischbach)
LPTC - lobula plate tangential cell
we’re gonna have to collectively ‘agree’ on a ‘universal’ names for these, at least for in here/this game so that we dont end up calling them 10 diff. things per person collectively biblically confusing all of us, lol.
Yes, some sort of list would be useful. If I’m going to write a script with a list of full names and short names of all optic lobe cells for Cell Completion, it better be a consistent list.
I use the conventions HQ used in the Optic Cell slideshow - Optic Lobe Cell Name Guide - Google Slides - which I think all follow Fischbach.
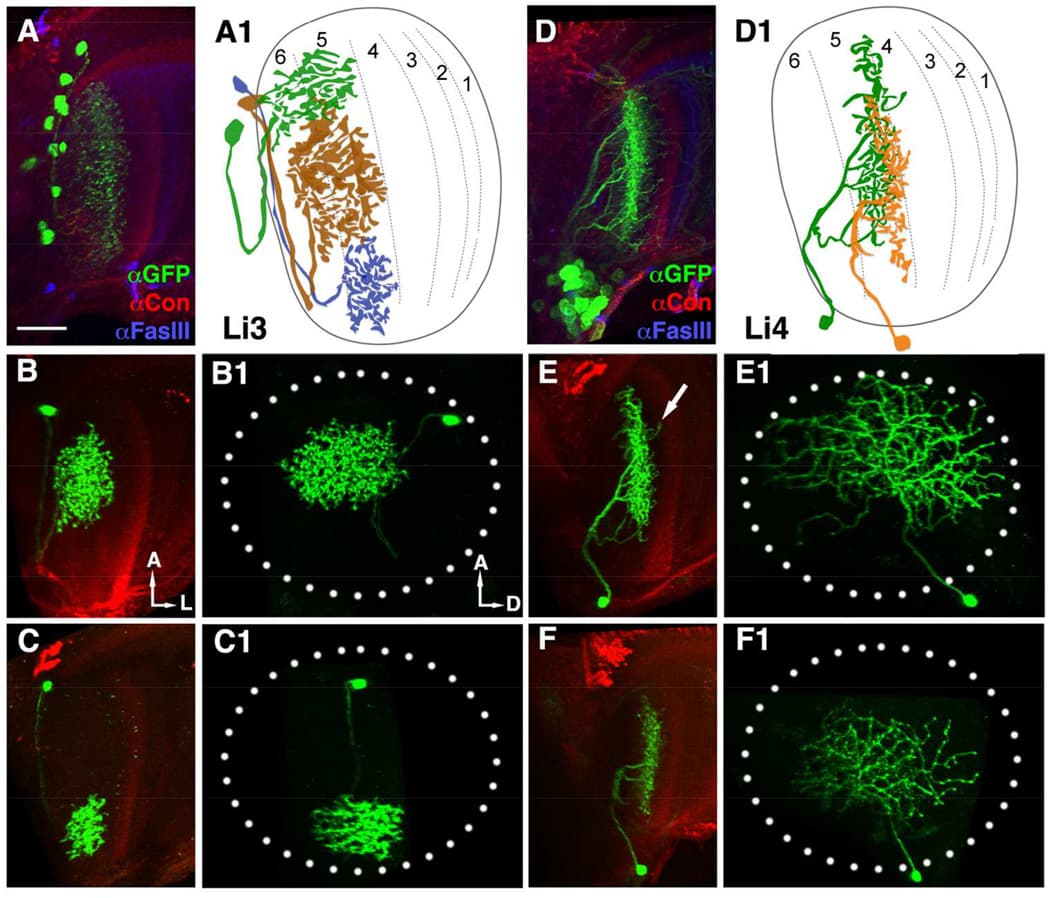
In each optic lobe, about 12 Li3 neurons elaborate dendritic arbors spanning the entire lobula strata 5 and 6 (A). Approximately 30 Li4 neurons, clustered in the posterior lobula cortex have dendritic arbors covering the entire lobula stratum 5.