Keywords: Mi13, Mi14, Mi15, TmY14
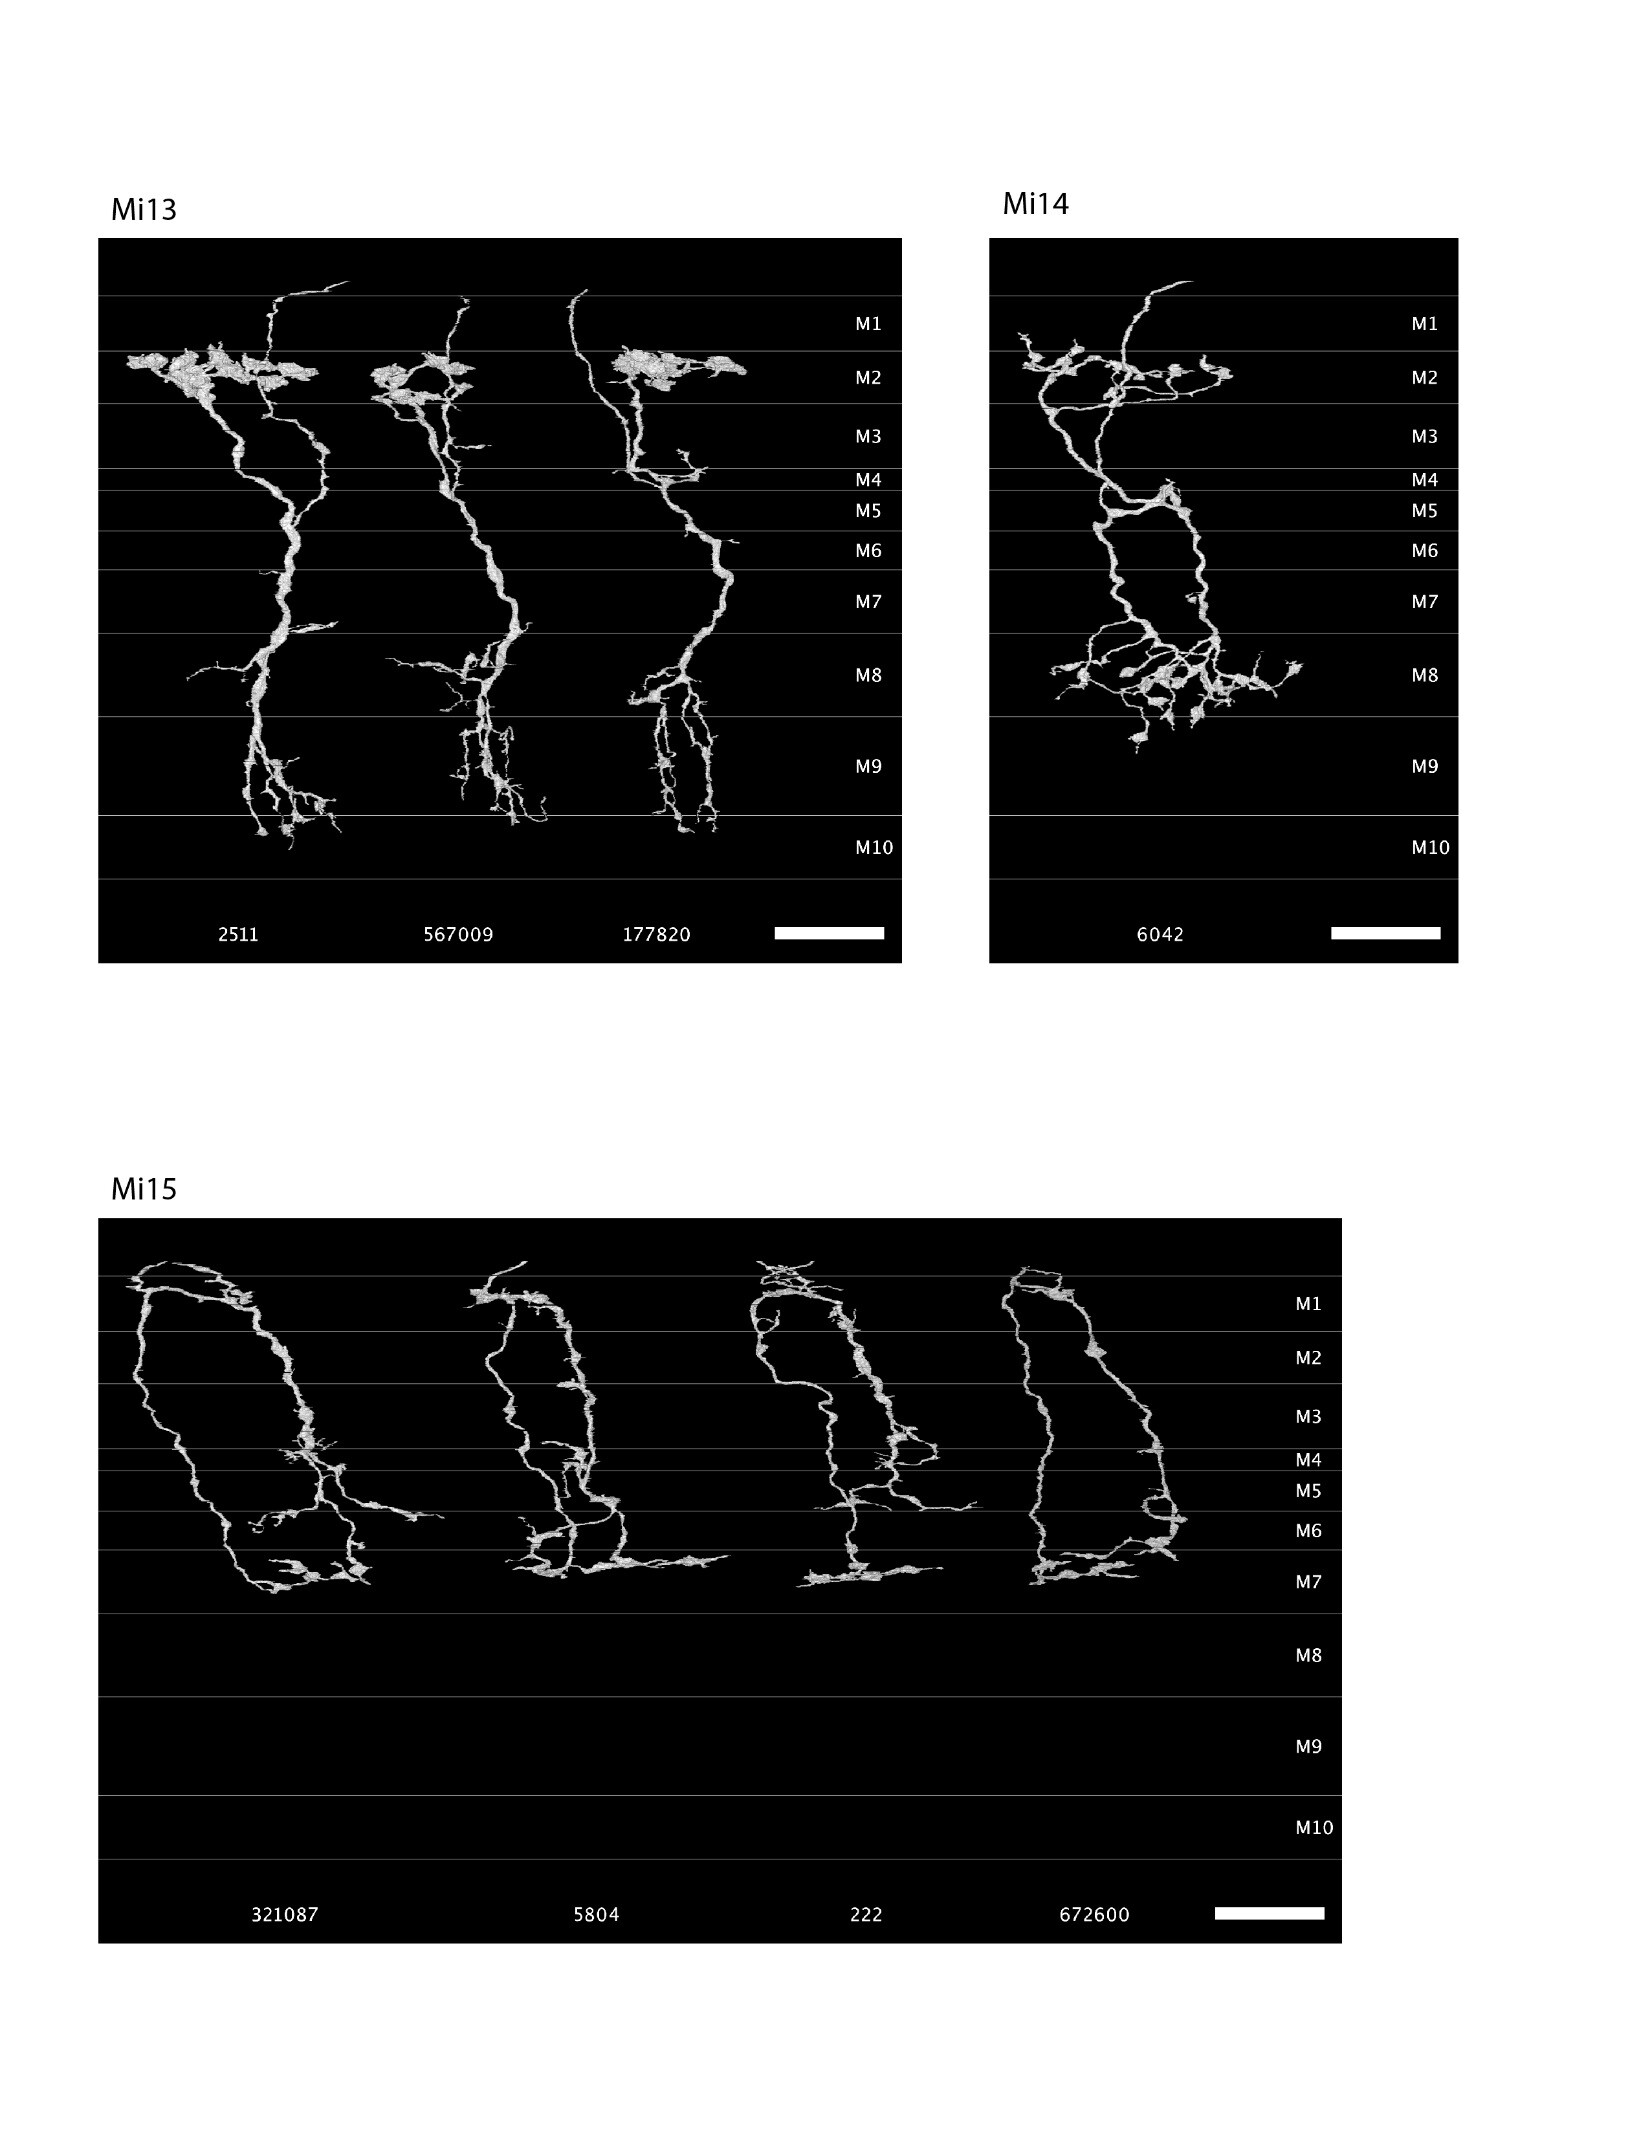
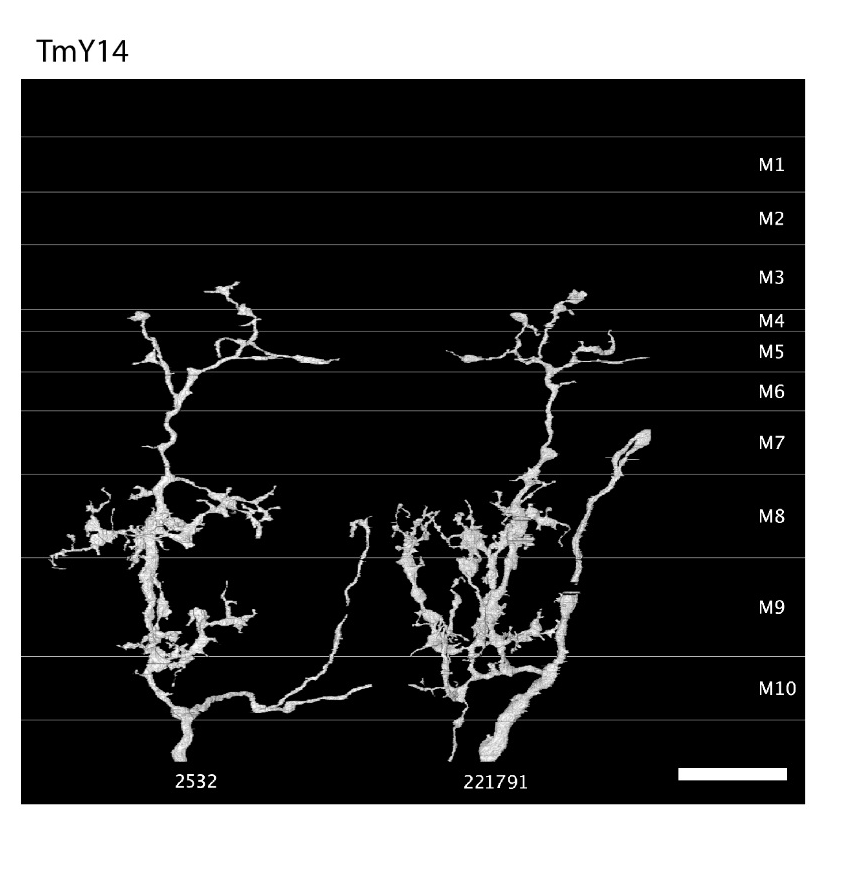
Source: https://www.researchgate.net/publication/255705988_A_visual_motion_detection_circuit_suggested_by_Drosophila_connectomics (Supplementary Material 2)
Keywords: Mi13, Mi14, Mi15, TmY14
Source: https://www.researchgate.net/publication/255705988_A_visual_motion_detection_circuit_suggested_by_Drosophila_connectomics (Supplementary Material 2)
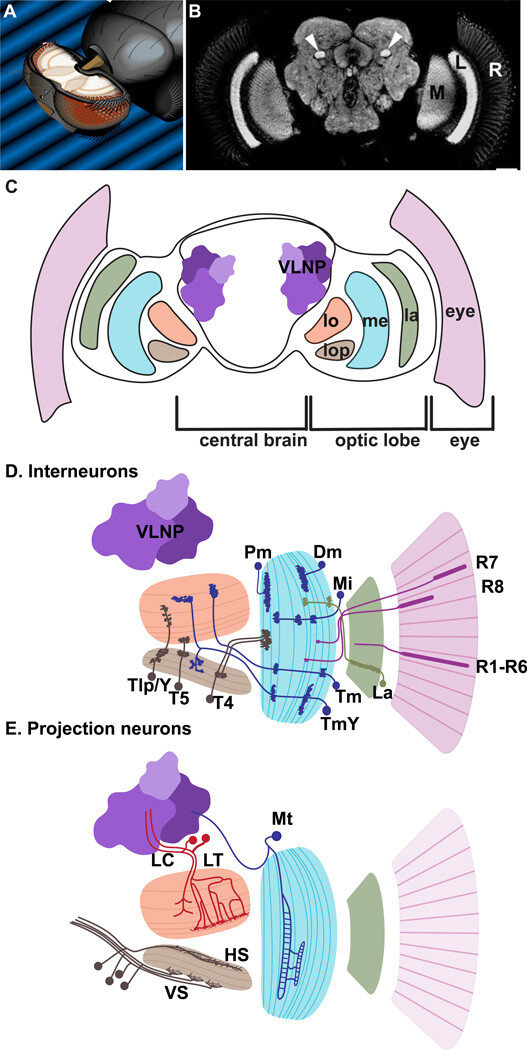
(A) The fly brain in the head; adapted from (Spalthoff et al. 2012). (B) Neuropils of the optic lobes and central brain; from (Krzeptowski et al. 2014). (C) Cross-section of the fly brain indicating the different part of the visual system: eye, lamina (la), medulla (me), lobula (lo), lobula plate (lop) and ventro-lateral neuropils (VNLP). (D) Interneurons of the optic lobe: outer and inner photoreceptors (pink), Lamina neurons (La, green), Medulla interneurons (dark blue): Distal (Dm) and Proximal medulla (Pm); Medulla intrinsic (Mi); unicolumnar Transmedullary ™ or multicolumnar TmY; Lobula plate interneurons (T4, T5, Tlp and Y neurons, dark brown). (E) Projections neurons: Medulla tangential (Mt, dark blue); Lobula columnar (LC, red) and tangential/tree-like (LT, red); Lobula plate tangential cells: HS and VS (dark brown). (D, E) adapted from (Erclik et al. 2009)
Source: From The Eye To The Brain: Development Of The Drosophila Visual System - PMC
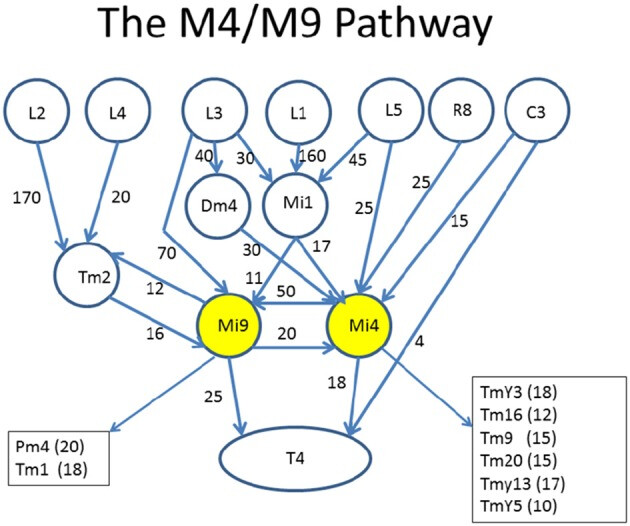
Circuits leading to Mi4 and Mi9, and hence to the motion detecting cell T4. To facilitate human understanding, the signal flow is largely uni-directional (top to bottom in this case), there are relatively few line crossings, and the edges are annotated with weights. This diagram was drawn manually, but automated and semi-automated tools to create such diagrams would be helpful. Data from Takemura et al. (2015).
Source: Analysis Tools for Large Connectomes - PMC
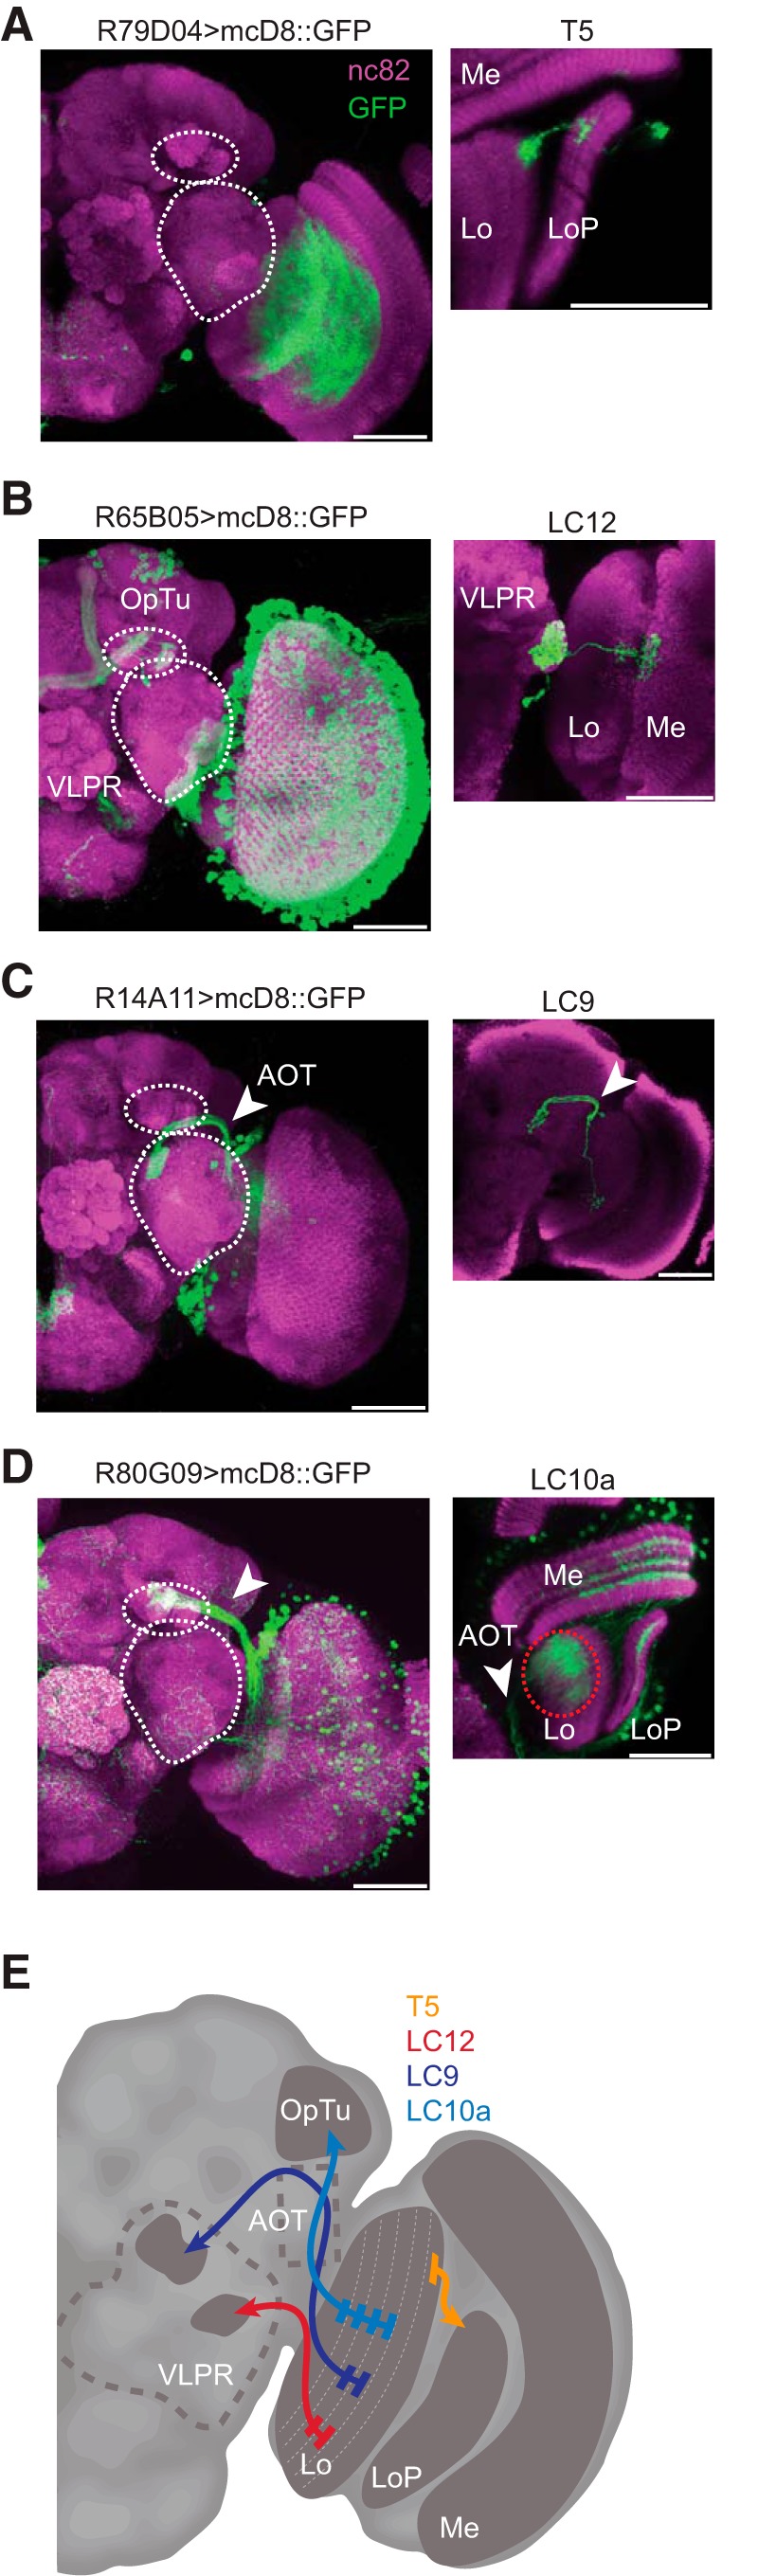
Anatomy of lobula projection neurons. All confocal images indicate nc982 neuropil staining in magenta and GFP in green. Scale bars, 50 μm. A , Whole-hemisphere labeling for R79D04 Gal4 line and single-cell example (inset) of a T5 neuron. B , Whole-hemisphere labeling for R65B05 Gal4 line and single-cell example (inset) of a LC12 neuron (shown glomerular region contains projections from multiple cells but only one of them shown); white dashed circles bound the optic tubercle (OpTu) and VLPR. C , Whole-hemisphere labeling for R14A11 Gal4 line and single-cell example (inset) of a LC9 neuron (shown glomerular region contains projections from multiple cells but only one of them shown). D , Whole-hemisphere labeling for R80G09 Gal4 line. We were unable to achieve single-cell labeling in this line, yet identified the LC10a subtype based on the axonal projections being confined only to the medial part of the optic tubercle (arrowhead). E , A schematic diagram depicting the input layers of the lobula and the projection targets of each cell type imaged (Mu et al., 2012).
Source: Neurons Forming Optic Glomeruli Compute Figure–Ground Discriminations in Drosophila - PMC
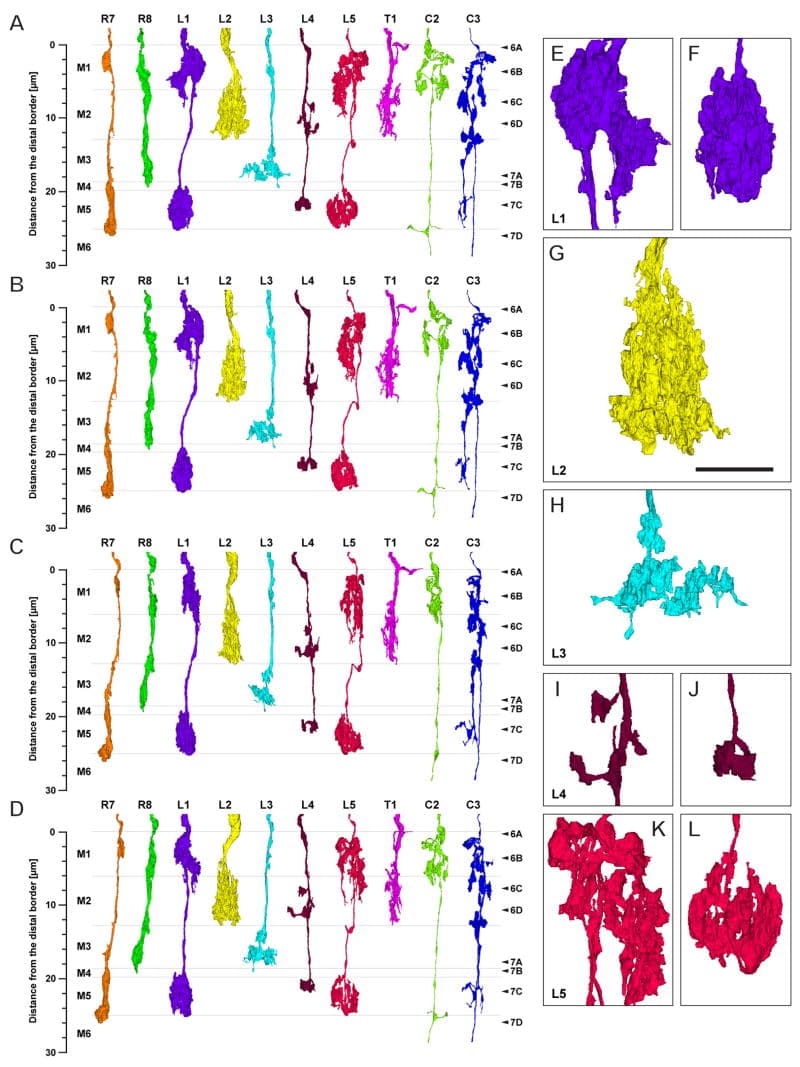
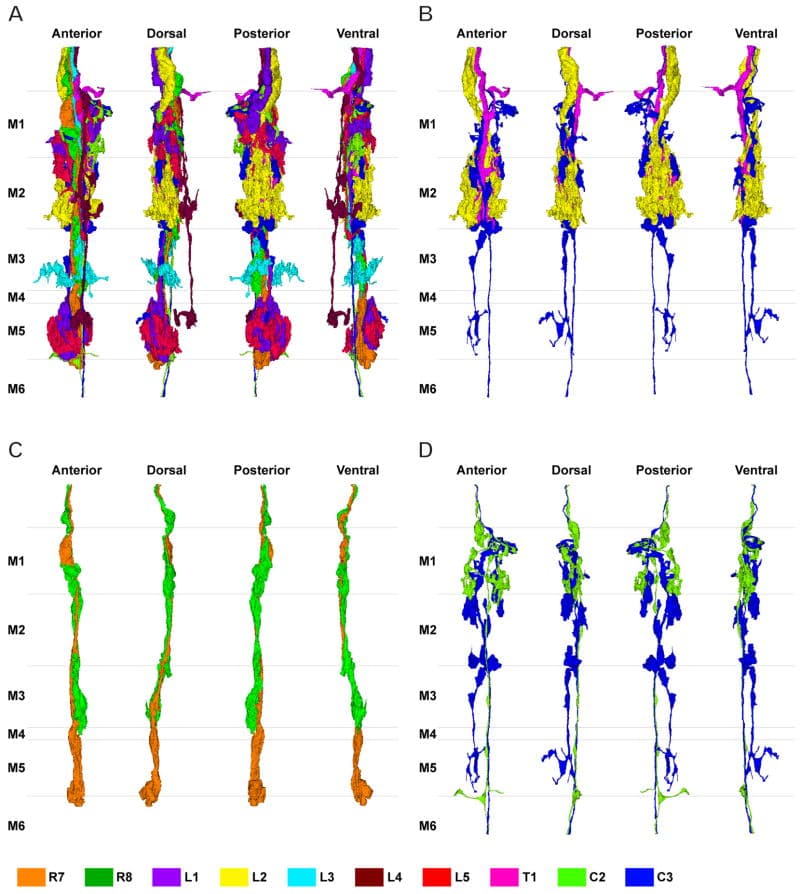
Profiles of the 10 cells reconstructed in three dimensions from column 2 in Fig. 2: R7 and R8, L1–L5, C2 and C3, and T1. Because the column is oval in cross section, each cell is shown from four views: from anterior looking posterior (A), in the plane of the chiasma, from dorsal looking ventral (C), and oblique views rotated 45° from the dorsal towards anterior (B) or towards the posterior (D). Borders are indicated between strata M1–M6. Estimated scale of the distance from the distal edge of stratum M1 is shown in the left side. The levels of panels in Figs. 6 and and77 are shown by arrowheads (right side). Enlarged images of terminal arbors of L1–L5 in a posterior view looking anterior (E–L): L1’s bi-lobed arbor in stratum M1 (E) and clubbed terminal in stratum M5 (F); L2’s terminal arbor in stratum M2 (G); L3’s terminal arbor in stratum M3 (H); L4’s spreading arbor in stratum M2 (I) and small terminal in stratum M5 (J); L5’s branched arborization in strata M1/M2 (K) and compact clump in stratum M5 (L). Scale bar: 5 μm (in G, same magnification for E–L)
Reconstruction of multiple terminals in a single column shown together from four different views at successive 90° rotations in a anticlockwise direction, from the distal surface looking in (far left: view from anterior looking posterior). A: 10 cells reconstructed together. B: C3 (blue) makes contact with L2 (yellow) and T1 (pink) in strata M1 and M2. C: R8 (green) travels with R7 (orange), and is presynaptic to R7. D: The main axon of C2 (yellow-green) and C3 (blue) travel side by side through the medulla within the column.
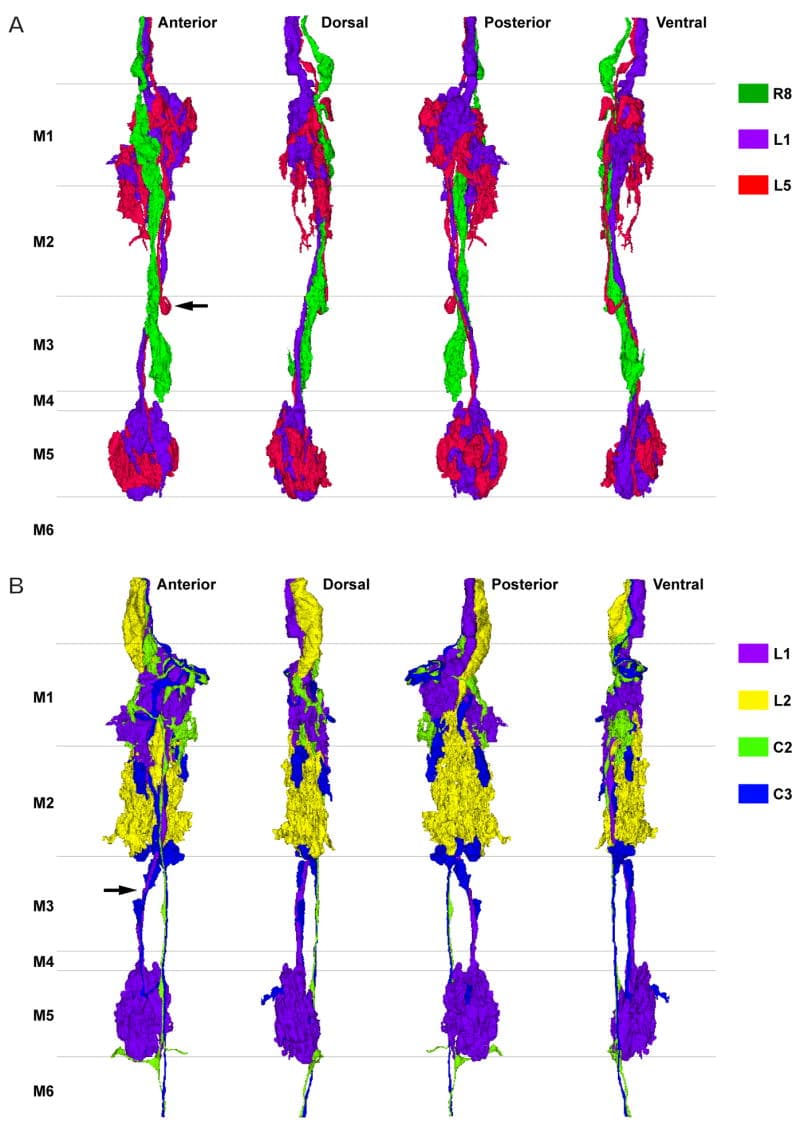
A: Reconstruction of the terminals of R8 (green), L1 (purple) and L5 (red). The terminals of L1 and L5 overlap each other closely and have reciprocal synaptic connections in strata M1 and M5. R8 is presynaptic to both L1 and L5 in stratum M1. The axon of L5 has a characteristic inflection around the depth between strata M2 and M3 (arrow). B: Reconstruction of L1 (purple), L2 (yellow), C2 (green), and C3 (blue). C3’s short collateral arising from its main axon at the border between strata M2 and M3 travels along the axon of L1 and has synaptic contacts in stratum M5 (arrow). C2 and C3 have numerous synaptic contacts with L1 and L2 (see text for details).
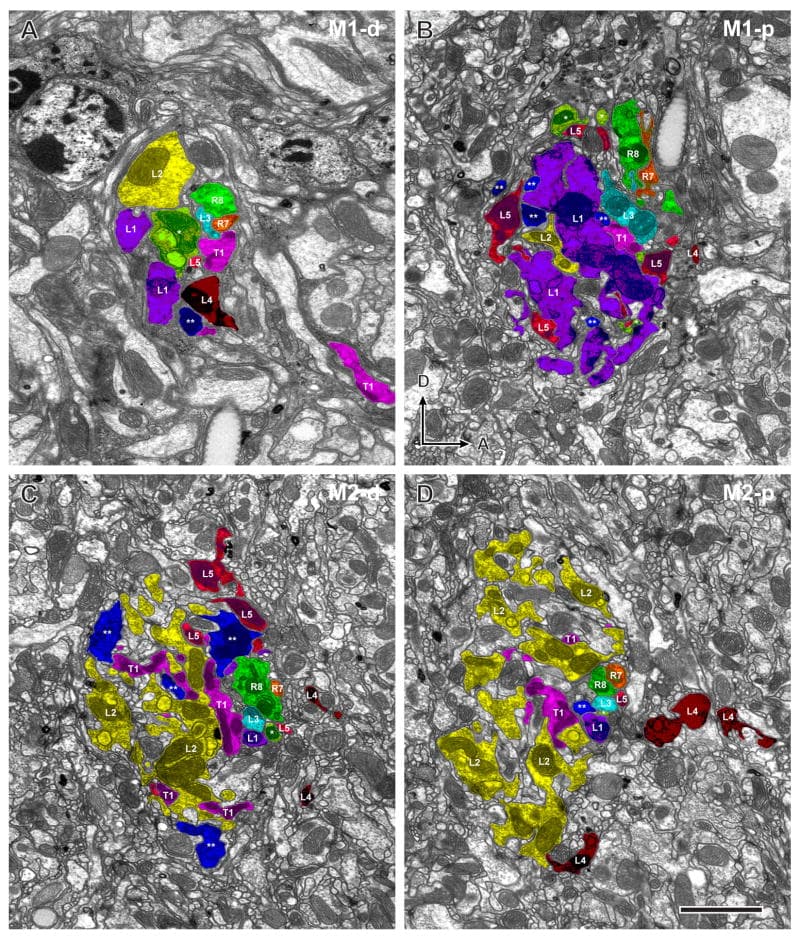
Four sections of column 2 from a series of 530 aligned images reveal profiles of all input terminals in the two outermost strata. Profiles of each cell are colour-coded as in Fig. 3, as follows: orange (R7), green (R8), purple (L1), yellow (L2), sky-blue (L3), dark-red (L4), pale-red (L5), yellow-green (C2), blue (C3), and pink (T1). A: Distal region of stratum M1 (M1-d) showing the axon bundle at the chiasma/neuropile border (section no. 73). B: Proximal region of stratum M1 (M1-p) at the level of the expanded terminals of L1 (section no. 123). C: Distal region of stratum M2 (M2-d) at the level of the expanded terminal of L2 (section no. 191). D: Proximal region of stratum M2 (M2-p) containing profiles of the L2 terminal and the divided profiles of the L4 arborization (section no. 240). Dorsal (D) and anterior (A) directions indicate the orientation of the head (in B, for all images). Scale bar: 2 μm (in D, for all images).
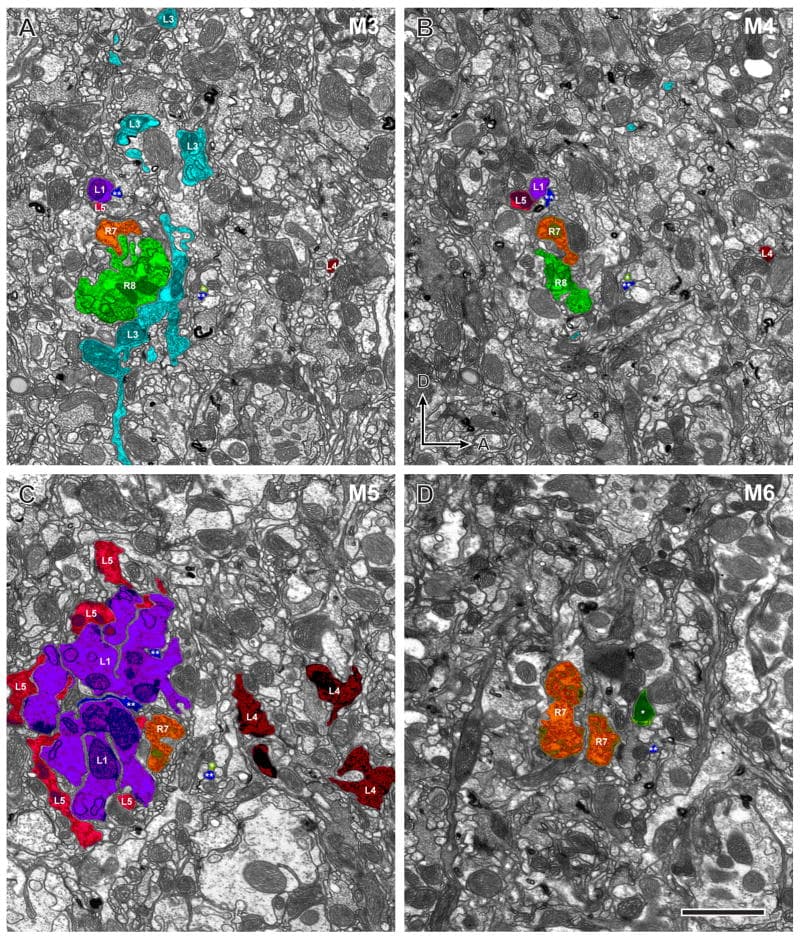
Four sections of column 2 in strata M3–M6, continuing those of Fig. 6. A: Stratum M3 containing the spreading terminals of L3 (section no. 347). Note that the dorso-ventrally directed processes of the L3 terminal extend slightly beyond the border of the panel. B: Stratum M4 (section no. 364). C: Stratum M5 at the level of the terminal of L5 and the proximal terminal of L1 showing the three terminals of L4 (section no. 416). D: Stratum M6 at the level of the profiles of the surviving R7 terminal (section no. 479). Dorsal (D) and anterior (A) directions indicate the orientation of the head (in B, for all images). Scale bar: 2 μm (in D, for all images).
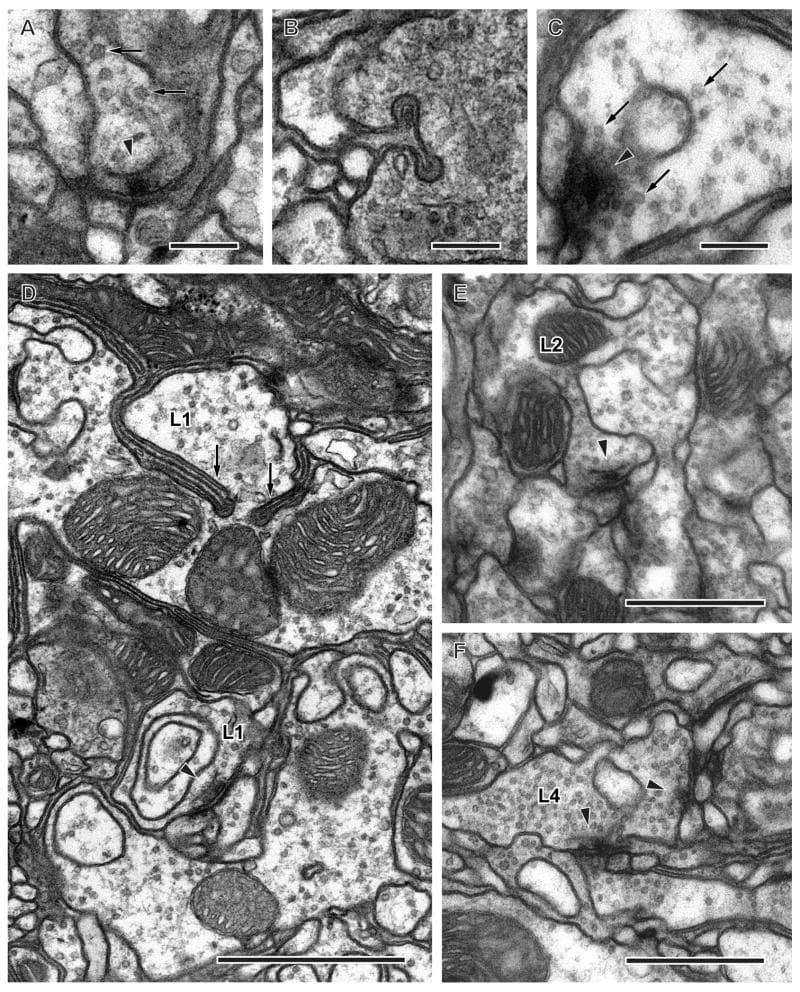
Synaptic organelles of photoreceptor and lamina cell terminals in the medulla. A: Presynaptic T-bar ribbon (arrowhead) and synaptic vesicles (arrows) in the photoreceptor terminal R8. B: Invaginating organelle, resembling a capitate projection, in the photoreceptor terminal, arising from an unidentified glial cell. C: Cruciform presynaptic density (arrowhead), the en face view of the pedestal of a T-bar ribbon, and surrounding synaptic vesicles (arrows) in L1 terminal. D: Terminals of L1 have thin invaginating partitions in stratum M5 (arrows). Arrowhead indicates cross-sectioned presynaptic T-bar ribbon in L1 profile. E: L2 is presynaptic to unknown profiles which are probably medulla cells (arrowhead). F: L4 is presynaptic to unidentified profiles which are probably medulla cells in stratum M5 (arrowheads). Scale bars: 0.2 μm (AC); 1 μm (D); 0.5 μm (E, F)
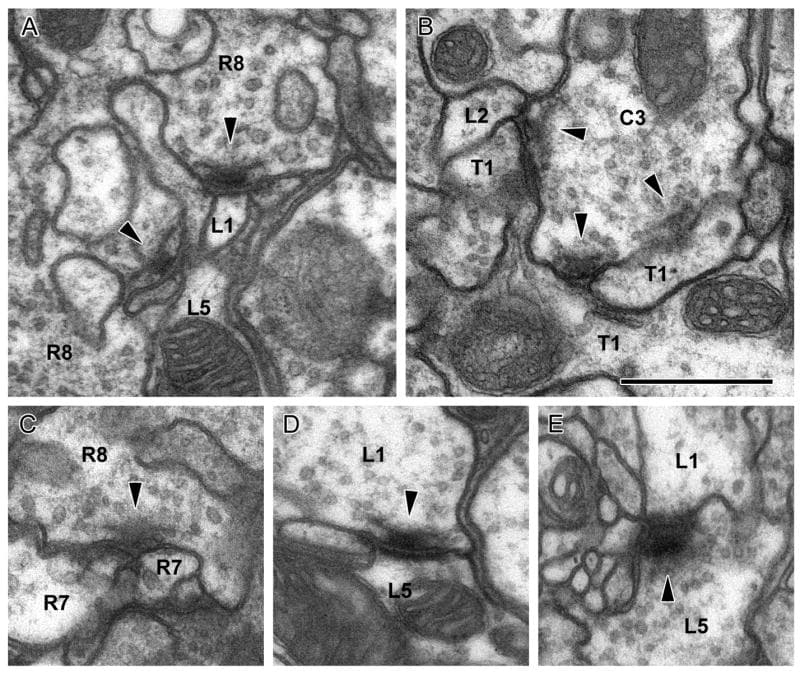
Synaptic contacts between input terminals in the medulla column. Arrowheads: T-bar ribbon in presynaptic elements. A: R8 provides input upon L1 and L5. B: C3 provides input upon L2 and T1. C: R8 provides input upon R7 at a dyad. D: L1 provides input upon L5, which is reciprocated at a second site (E). All synapses are of the multiple-contact type and additional postsynaptic elements are not identified. Scale bar: 0.5 μm (in B, for all images).
Source for all images: Synaptic circuits of the Drosophila optic lobe: the input terminals to the medulla - PMC
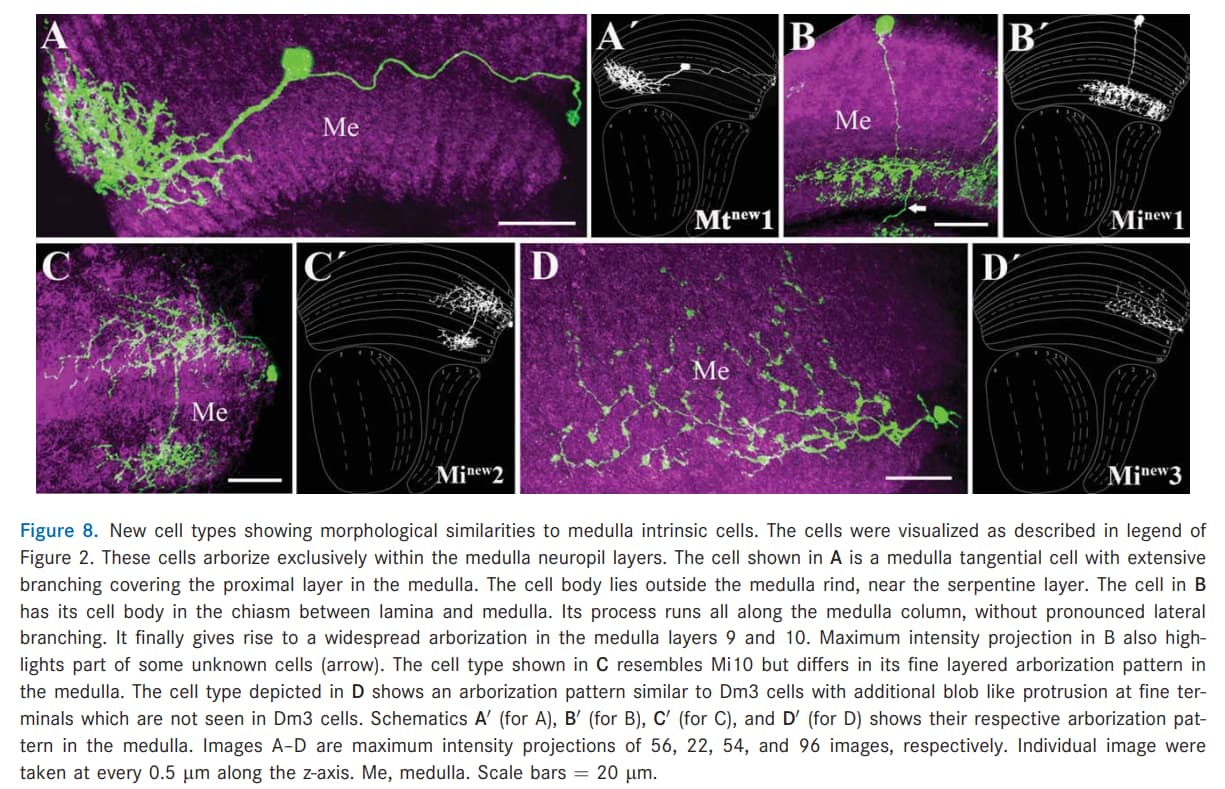
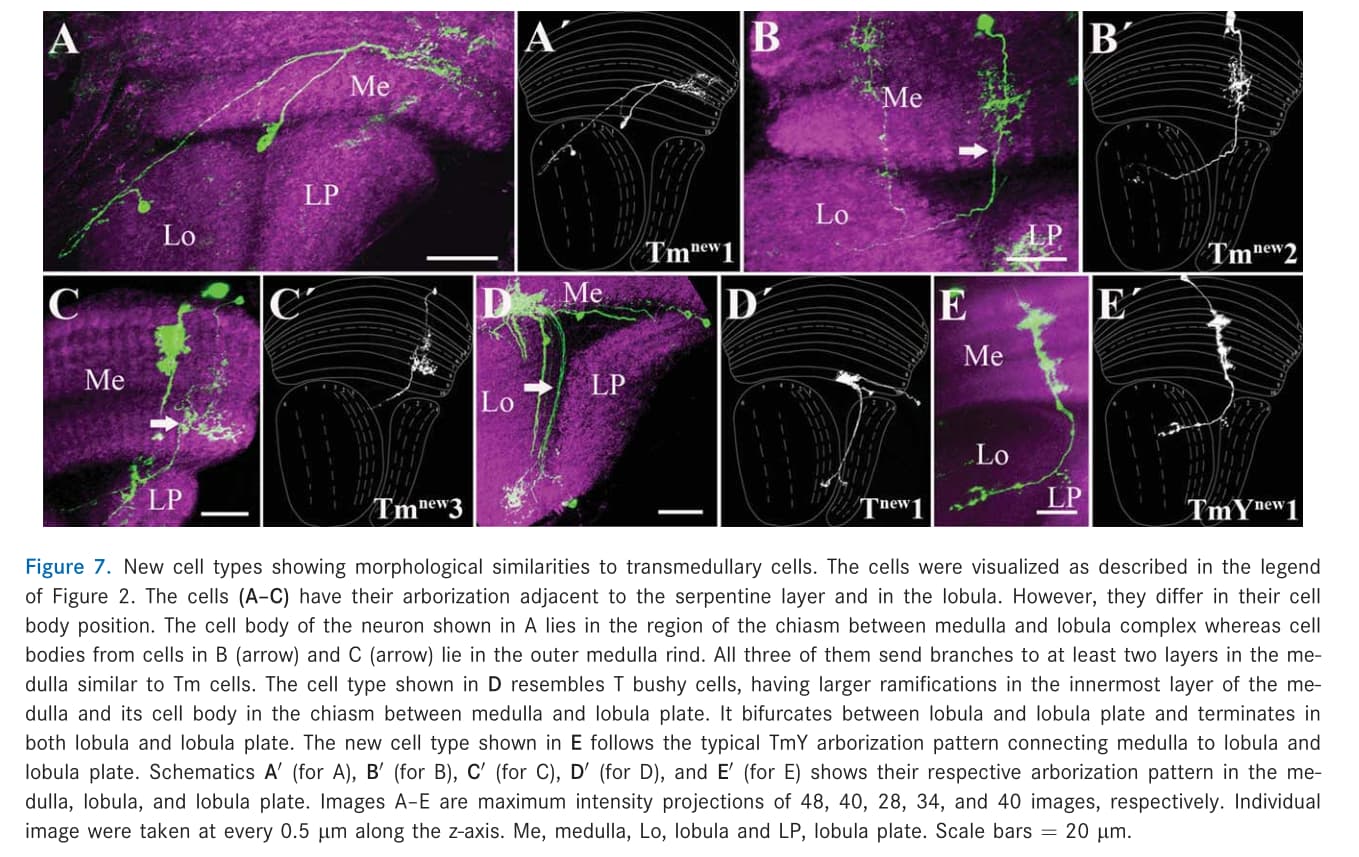
I’ve found a paper with some new cells (screenshots below). What’s important, is that the pape contains name that is the same in a different paper for a different cell - Mt(new)1 (post).
That’s why it’s important, at least for the newer cells to not only add the cell’s short and long name but also the source. The other reason is, ofc, that the same type of cells can have different names in different papers.
The source is " Neurons with cholinergic phenotype in the visual system of Drosophila" by Shamprasad Varija Raghu, Dierk F. Reiff, and Alexander Borst (2011). https://doi.org/10.1002/cne.22512
Can’t give an online source for the full text, because I only found it as a pdf on some shady website.
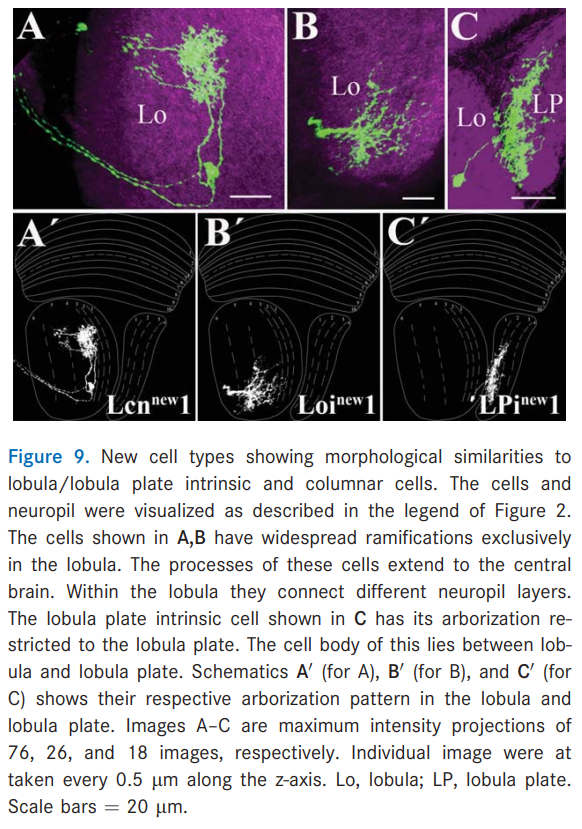
Keywords: Mt(new)1, Mi(new)1, Mi(new)2, Mi(new3), Lcn(new)1, Loi(new)1, LPi(new)1.
There’s also this Loi(new)1 cell. I wonder, if this is a different name for Li cells or some new category.
And another example of this naming problem:
Source: The comprehensive connectome of a neural substrate for ‘ON’ motion detection in Drosophila | eLife
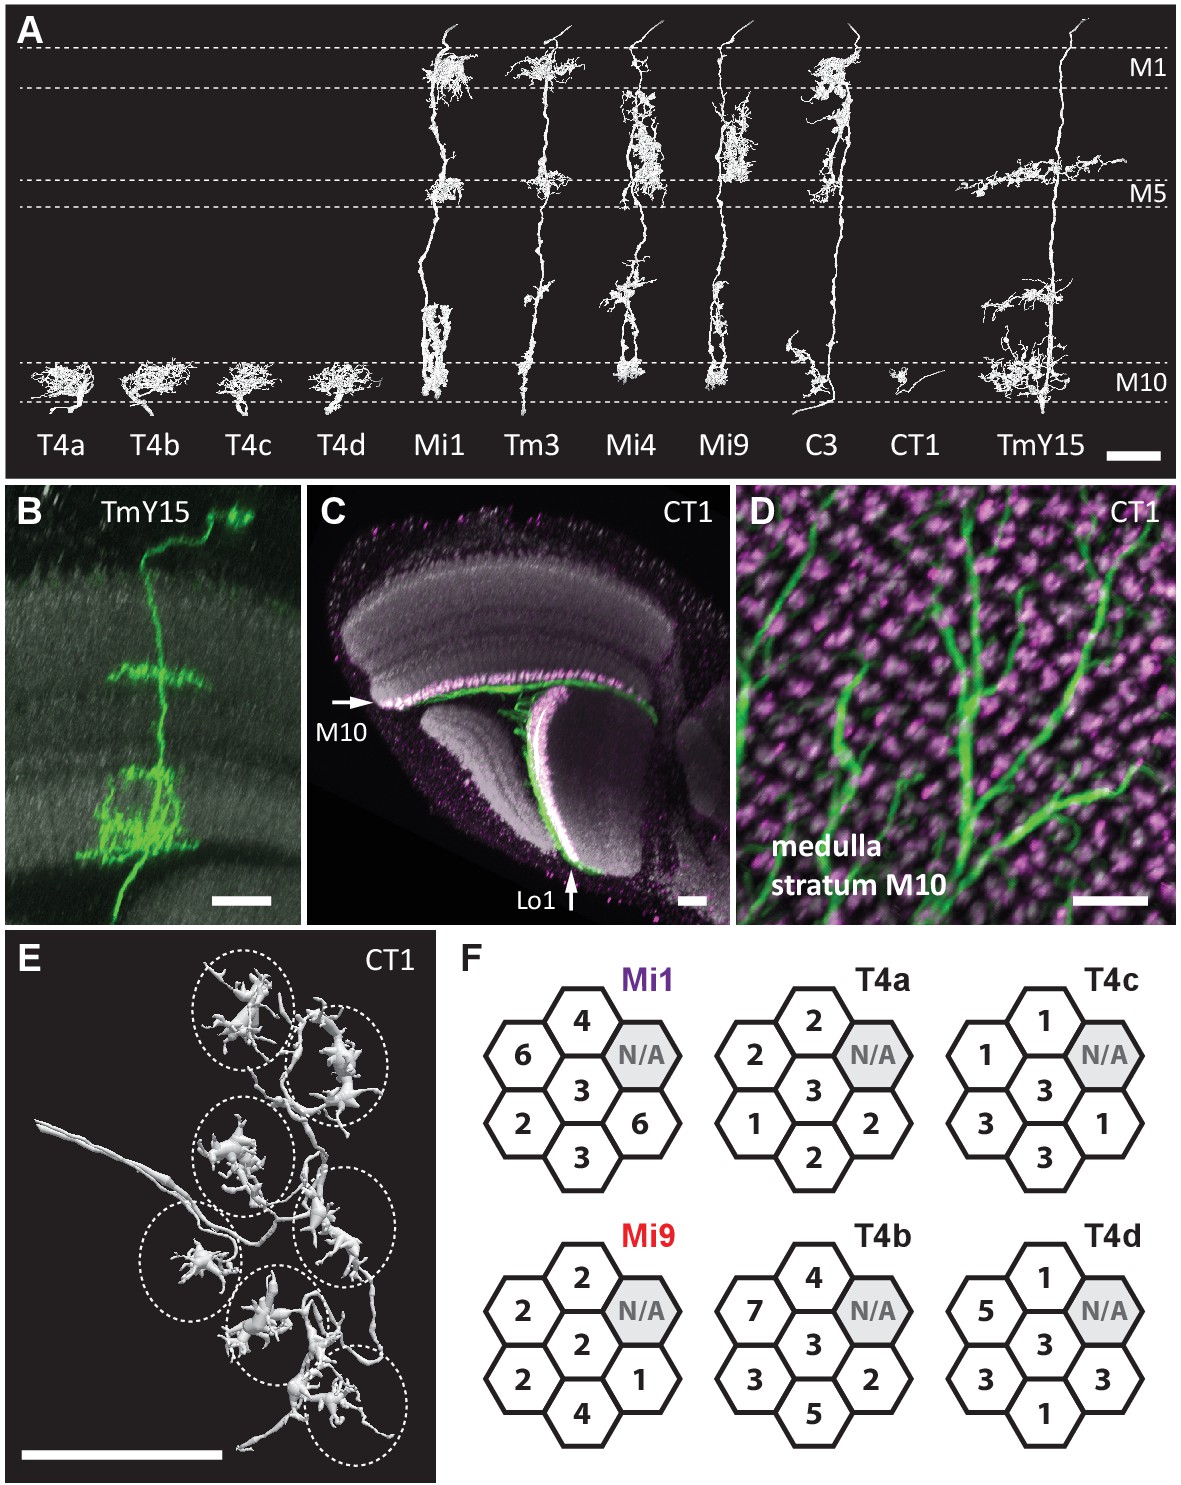
TmY15 from this picture looks quite different than the one from this picture from AJ’s post.
This is great and definitely does bring up a good issue about naming and cell ID. Personally I think it may be best if we add a citation for the morphology if it’s not Fischbach. Fischbach seems like the generally agreed source/standard that everyone has been working from, but obviously there have been some different approaches since.
Thanks.
I’m currently working on an addon that will allow to add cells’ names easier during identification process. I’ll soon open a new thread for discussion, for how the names should look like.
An update to this while I was researching cell name types: Loi is just another term for Lobula intrinsic (instead of Li). See mentions in ex: https://www.cell.com/current-biology/pdfExtended/S0960-9822(17)30012-X
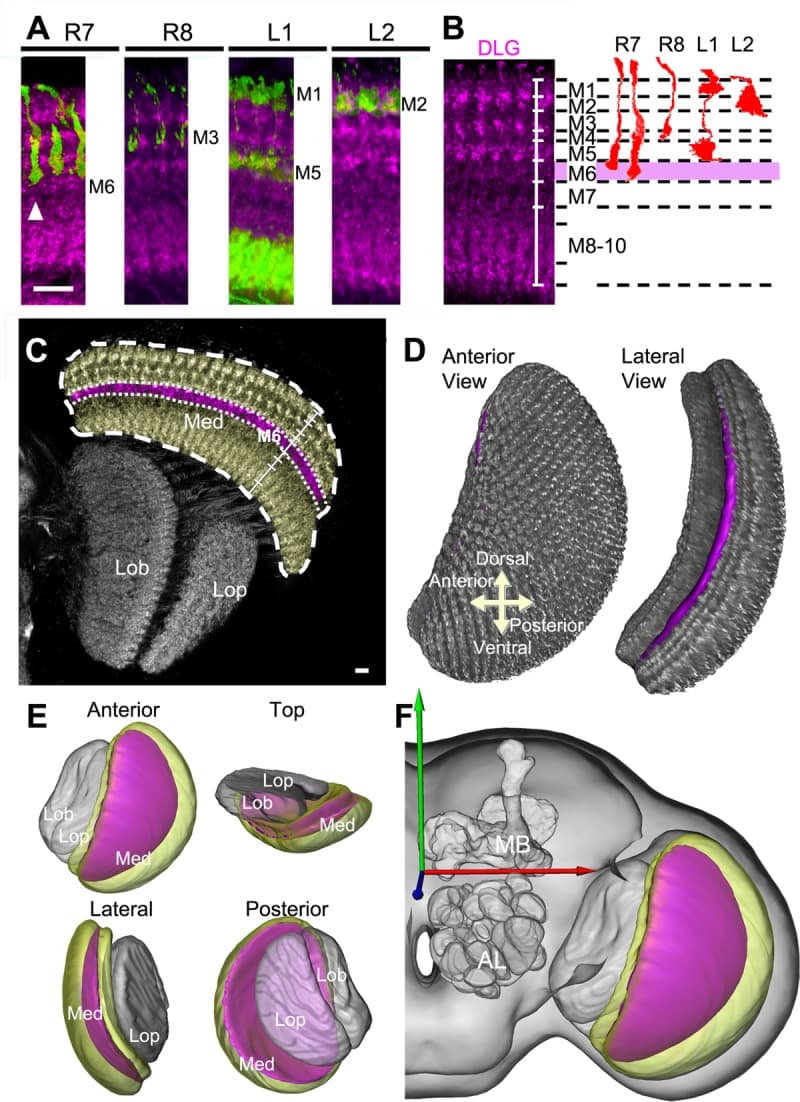
Generation of medulla volume models. A: Arborizations of retinotopic afferents (green) within medulla columns in relation to DLG-immunostained medulla strata (magenta). A long-form R7 (arrowhead) defines the proximal boundary of M6. B: Identification of specific strata in the distal medulla (M1–M6) based on differences in DLG-immunostaining intensity (left), using specific columnar neurons as references (right). C: Segmentation of the M6 stratum (magenta) and medulla (yellow) from the DLG-immunostained optic lobe (gray). D: Volume rendering of the M6 stratum (magenta) within the medulla (gray). E: Spatial relationship of M6 (magenta), medulla (yellow), lobula, and lobula plate (gray) volume models. F: The M6 volume model provided by the standard model fly brain. Med, medulla; Lob, lobula; Lop, lobula plate; MB, mushroom body; AL, antennal lobe. Scale bars = 10 μm.
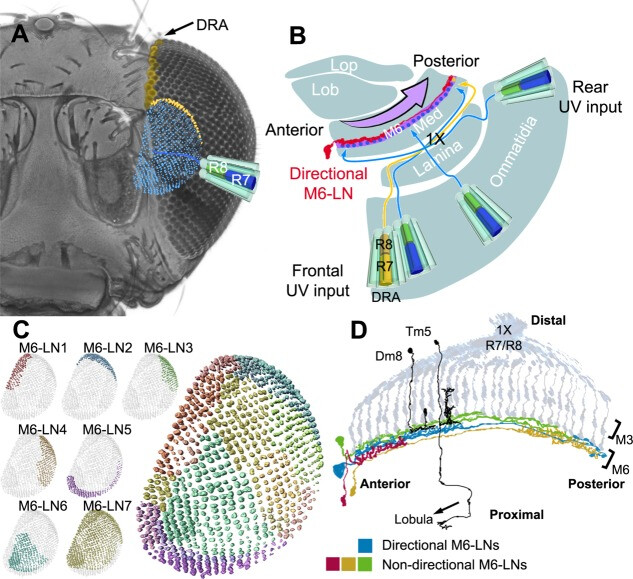
Schematic representation of UV vision in the M6 stratum. A: Retinotopic representation of UV-sensitive neurons in the M6 stratum. Each of approximately 800 R7 neurons relays UV information along one column to terminate at the M6 stratum, forming a UV retinotopic map (blue). The UV polarization-detecting DRA neurons (yellow) project to the dorsal-lateral M6 stratum. B: Top view of the left optic lobe shows chiasmatic information relay (×1) from frontal and rear ommatidia to posterior and anterior M6, respectively. Directional M6-LNs (red) relay information from the anterior to the posterior M6 (arrow). Med, medulla; Lob, lobula; Lop, lobula plate. C: Innervation territories of nondirectional M6-LN clusters (shown in different colors) form a mosaic of seven domains, covering the whole M6 retinotopic field. D: Functional motif in the M6 stratum: R7/R8 input neurons, narrow-field output projection neurons (black; i.e., Dm8 to the M4 stratum and Tm5 to the lobula), nondirectional LNs (green, red, and orange), and directional M6-LNs (blue).
Both images from: Diversity and wiring variability of visual local neurons in the Drosophila medulla M6 stratum - PMC
The first image helps with identifying layers in the Medulla. As one can see (C), there’s a recess around the Medulla (also visible in our rendered neuropils, no to much in the 2D view, but you can still see the layers). Above that is the M6 layer, as marked on the picture. The layer below is M7. It’s sometimes called serpentine layer. It separates Outer (Distal) Medulla from Inner (Proximal) Medulla. So, Dm cells should be above the recess, and Pm below it (closer to Lobula).
FlyLight | Janelia Research Campus a researcher just asked how to find neurons by name from this site in fw. lol tyty sharing this here if it’s not already. hehe
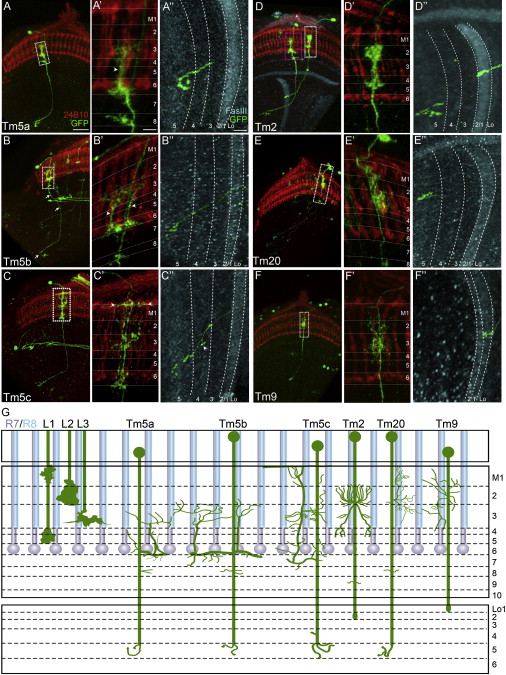
Different subtypes of Tm5:
Source: The Neural Substrate of Spectral Preference in Drosophila: Neuron
That’s probably the reason, why there are 4 slightly different Tm5’s in the Dischbach’s paper.
Keywords: Tm5a, Tm5b, Tm5c, Tm2, Tm9, Tm20
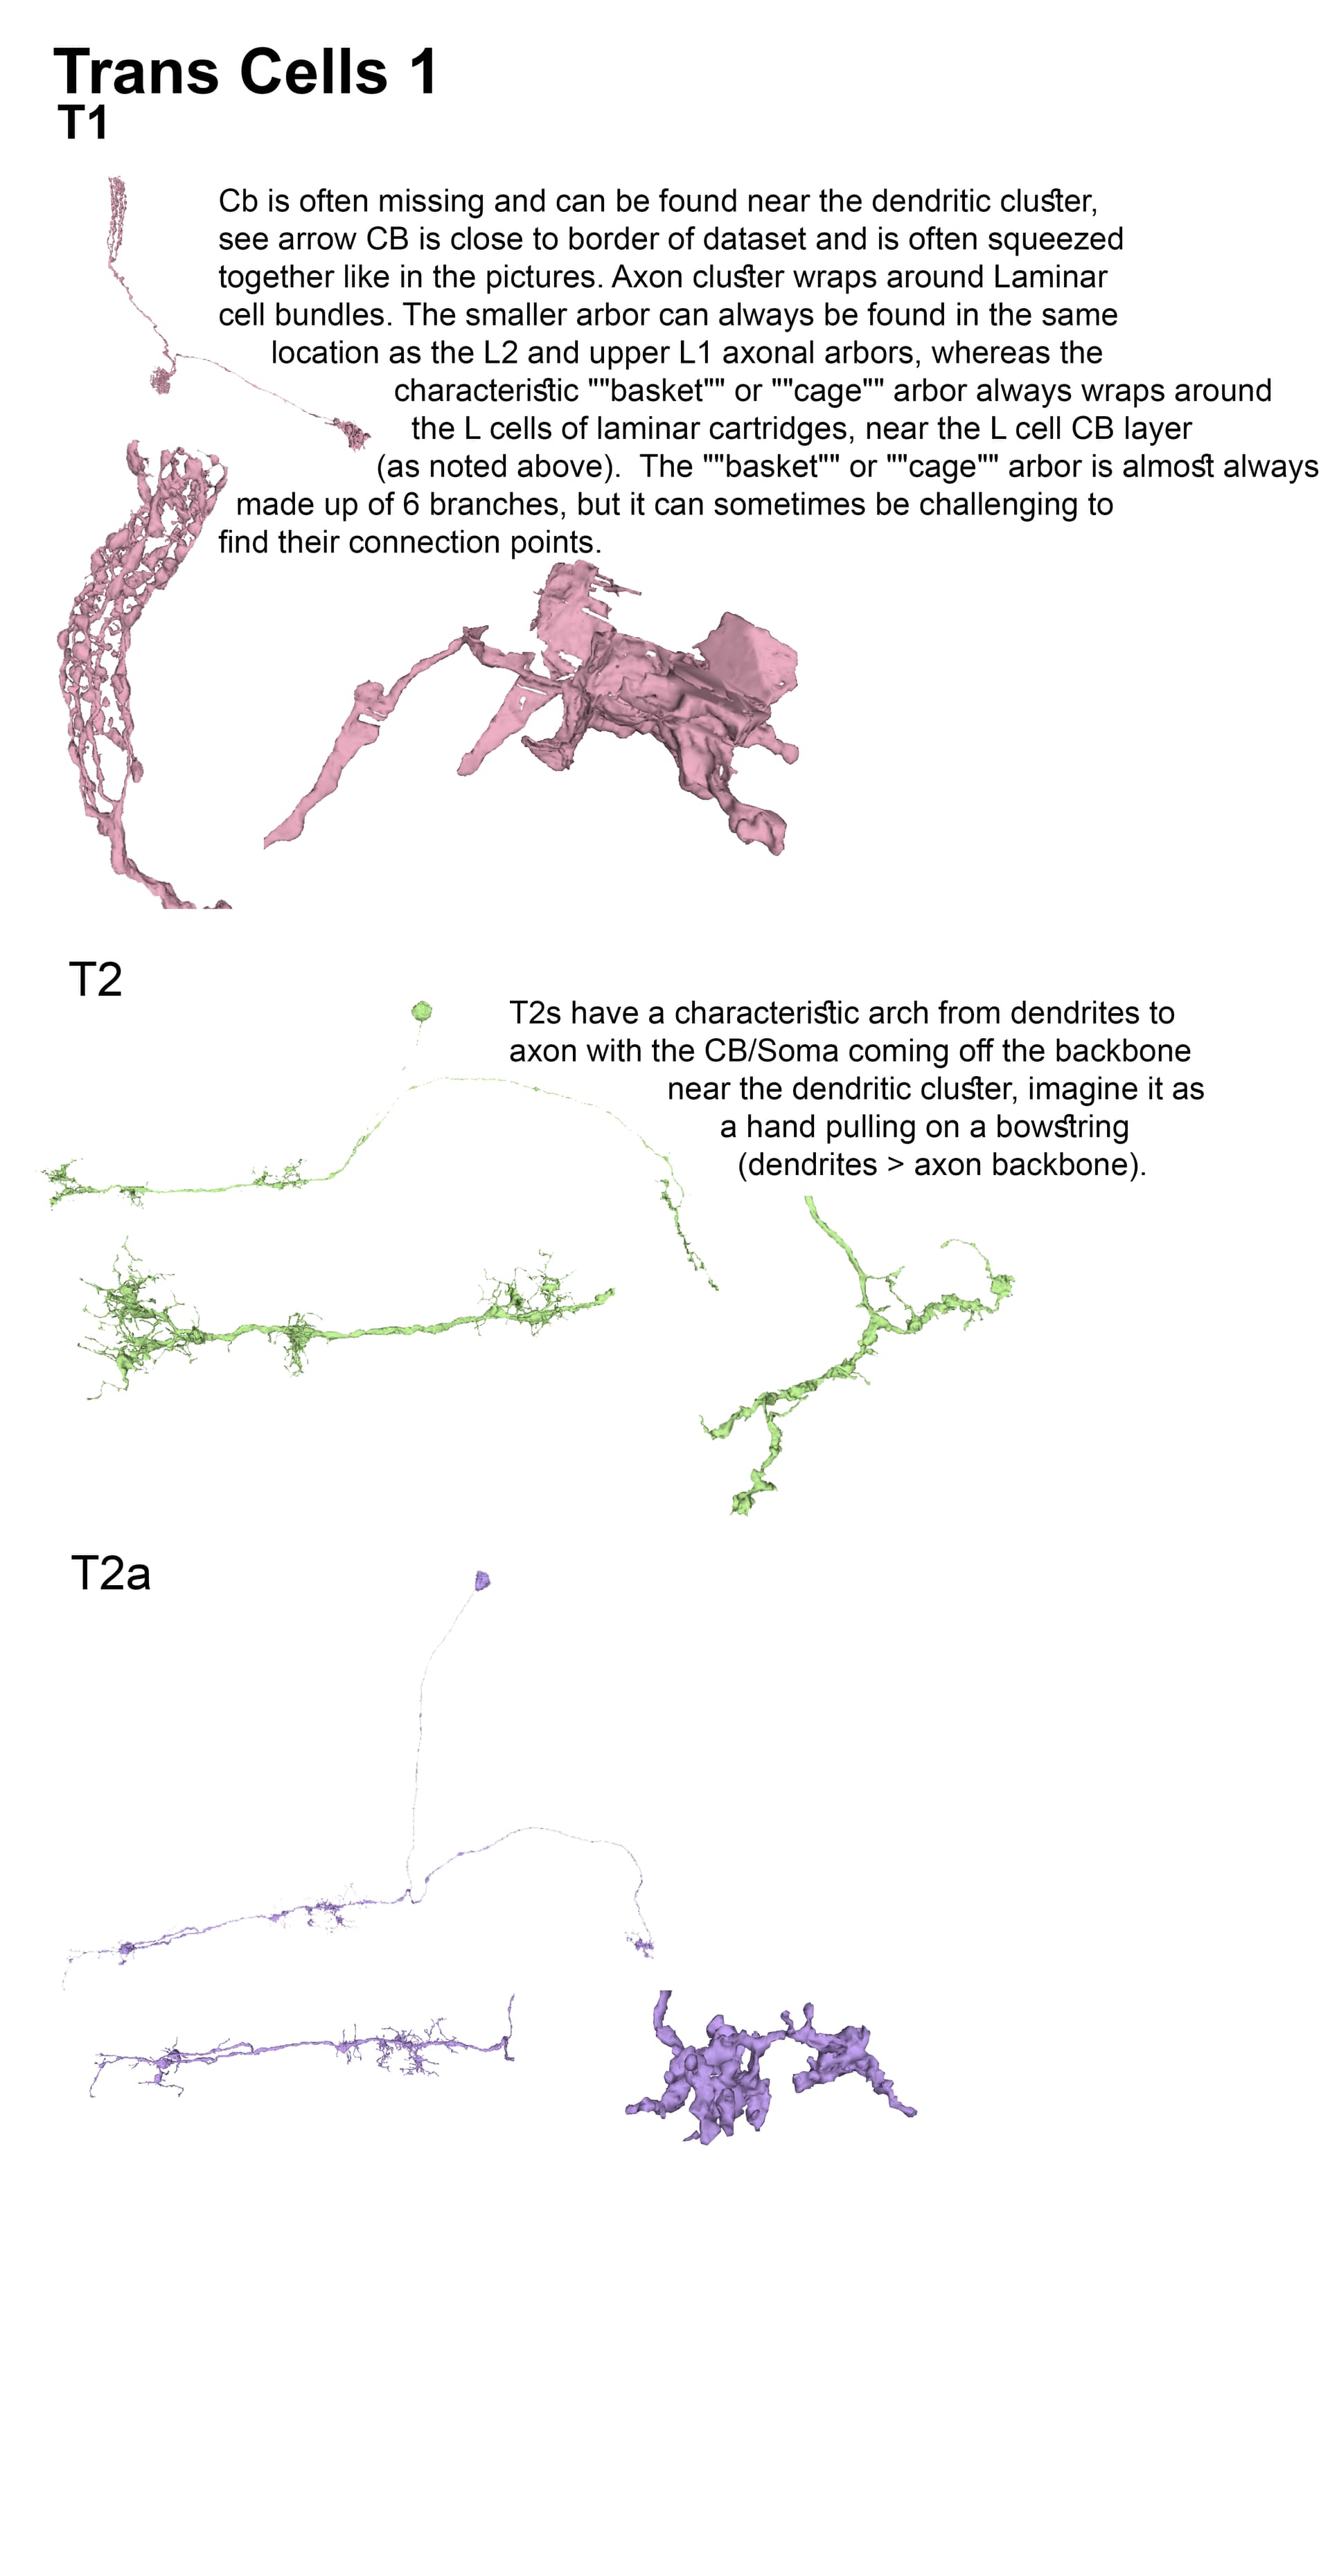
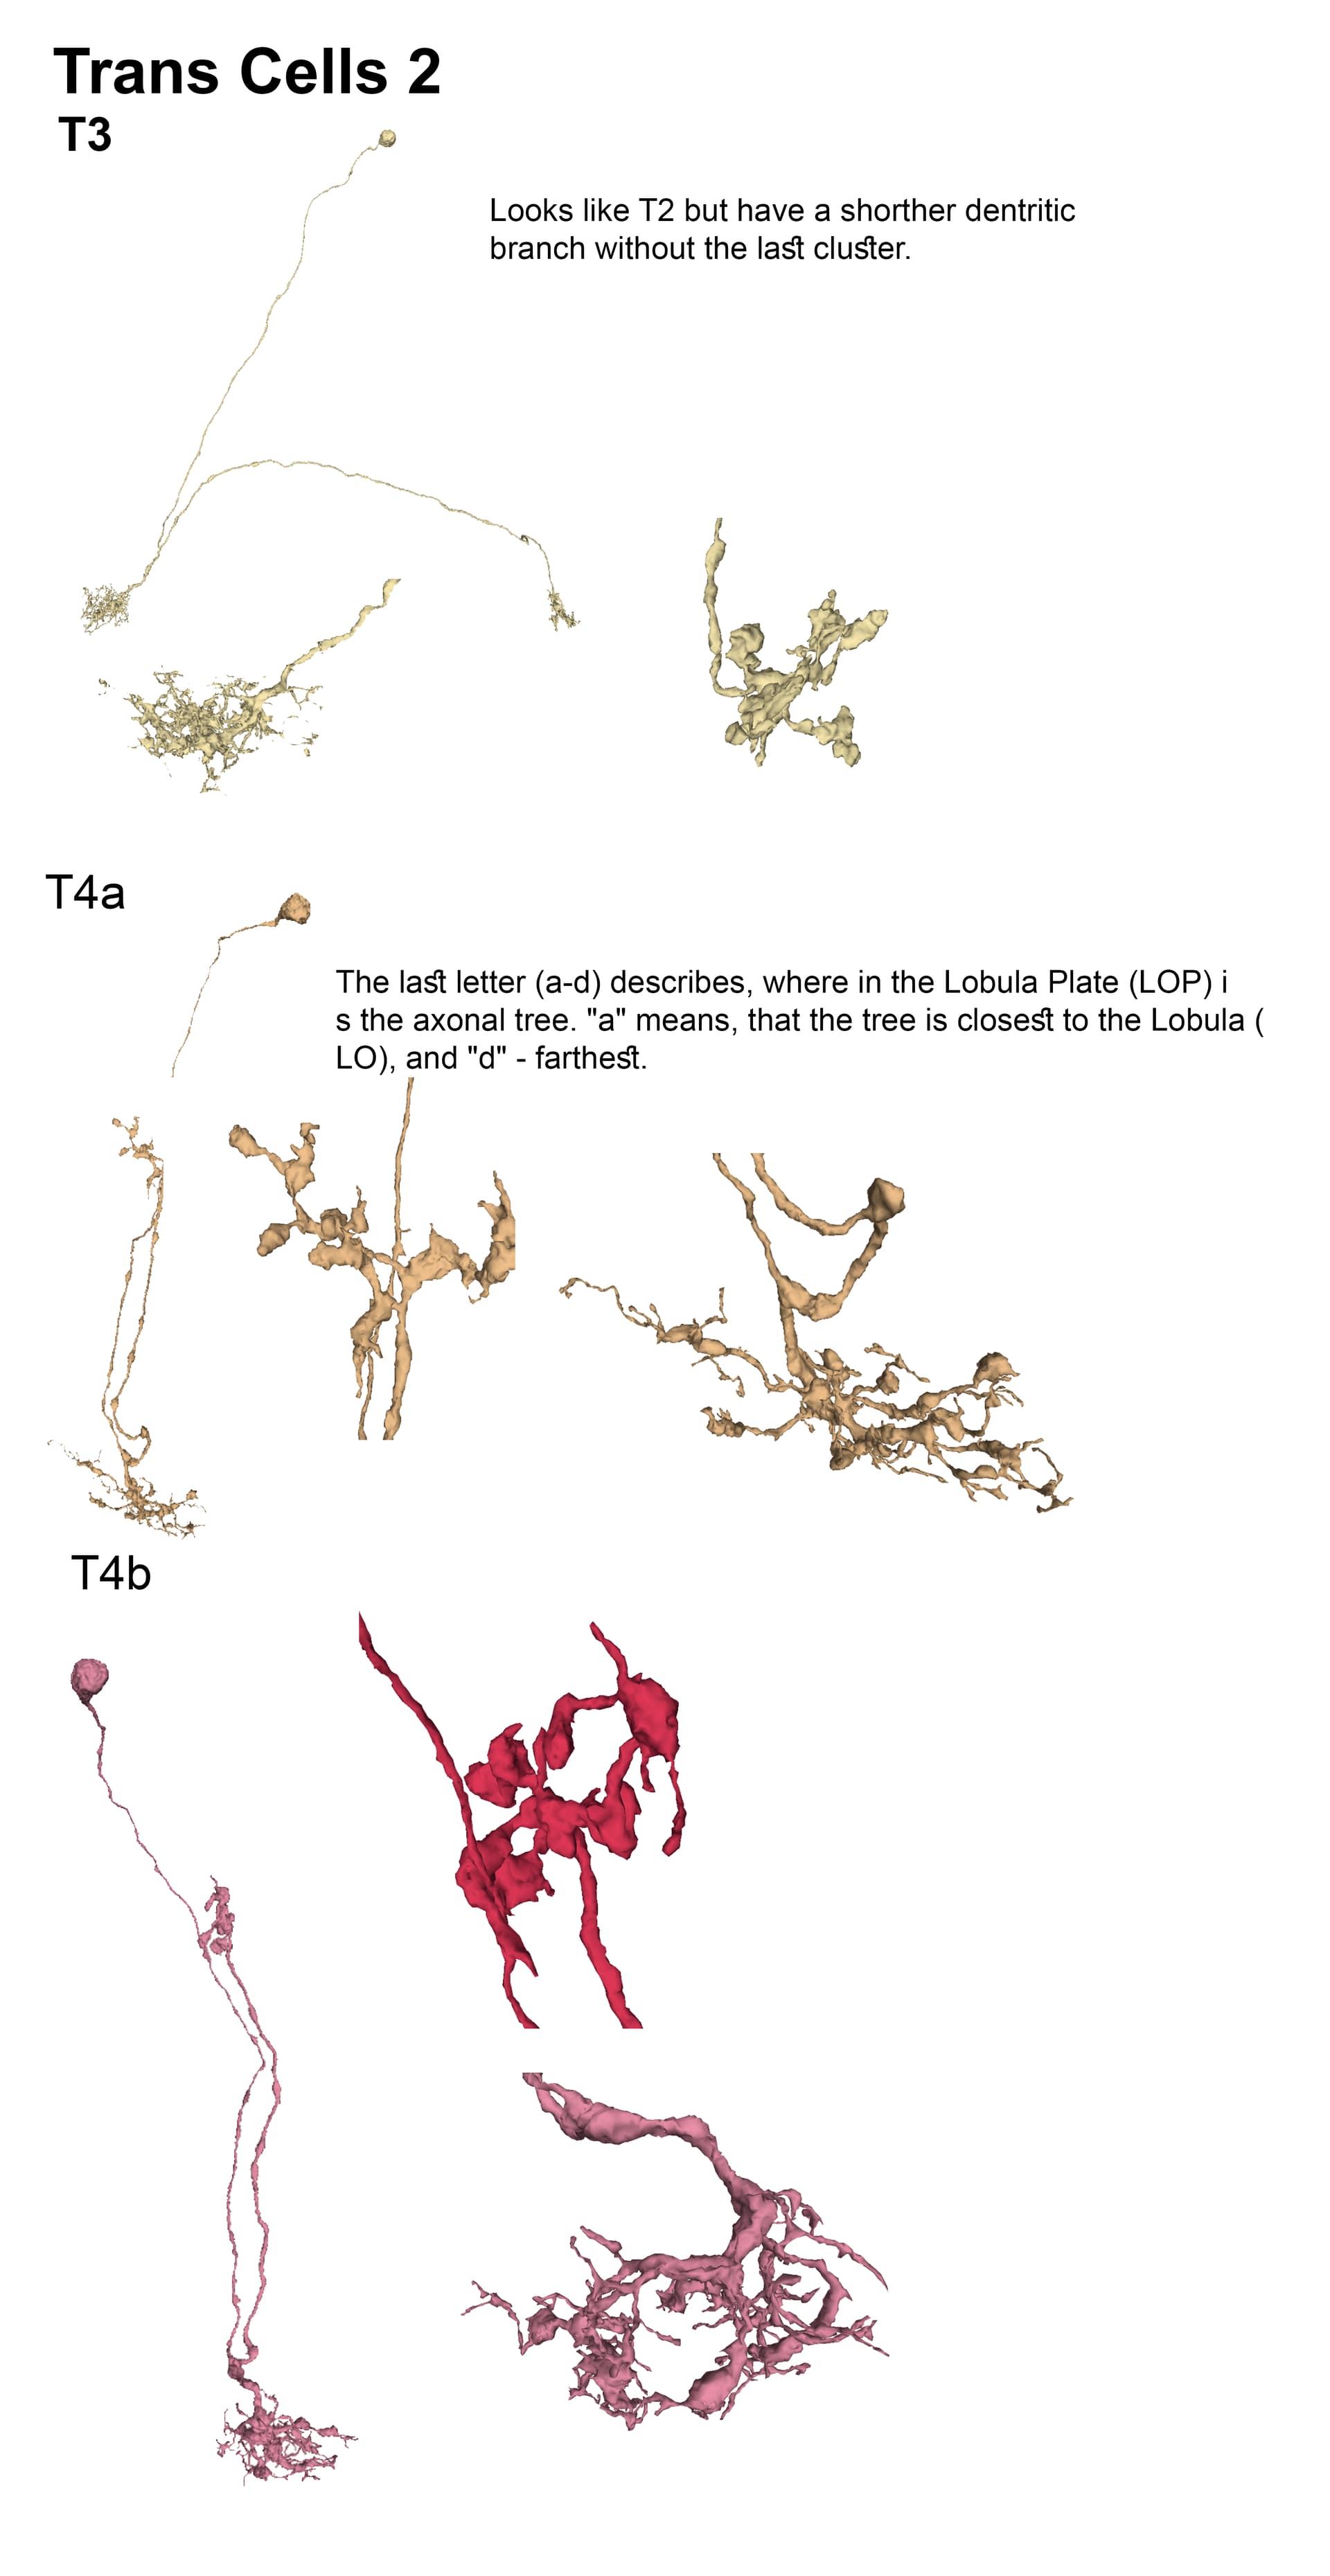
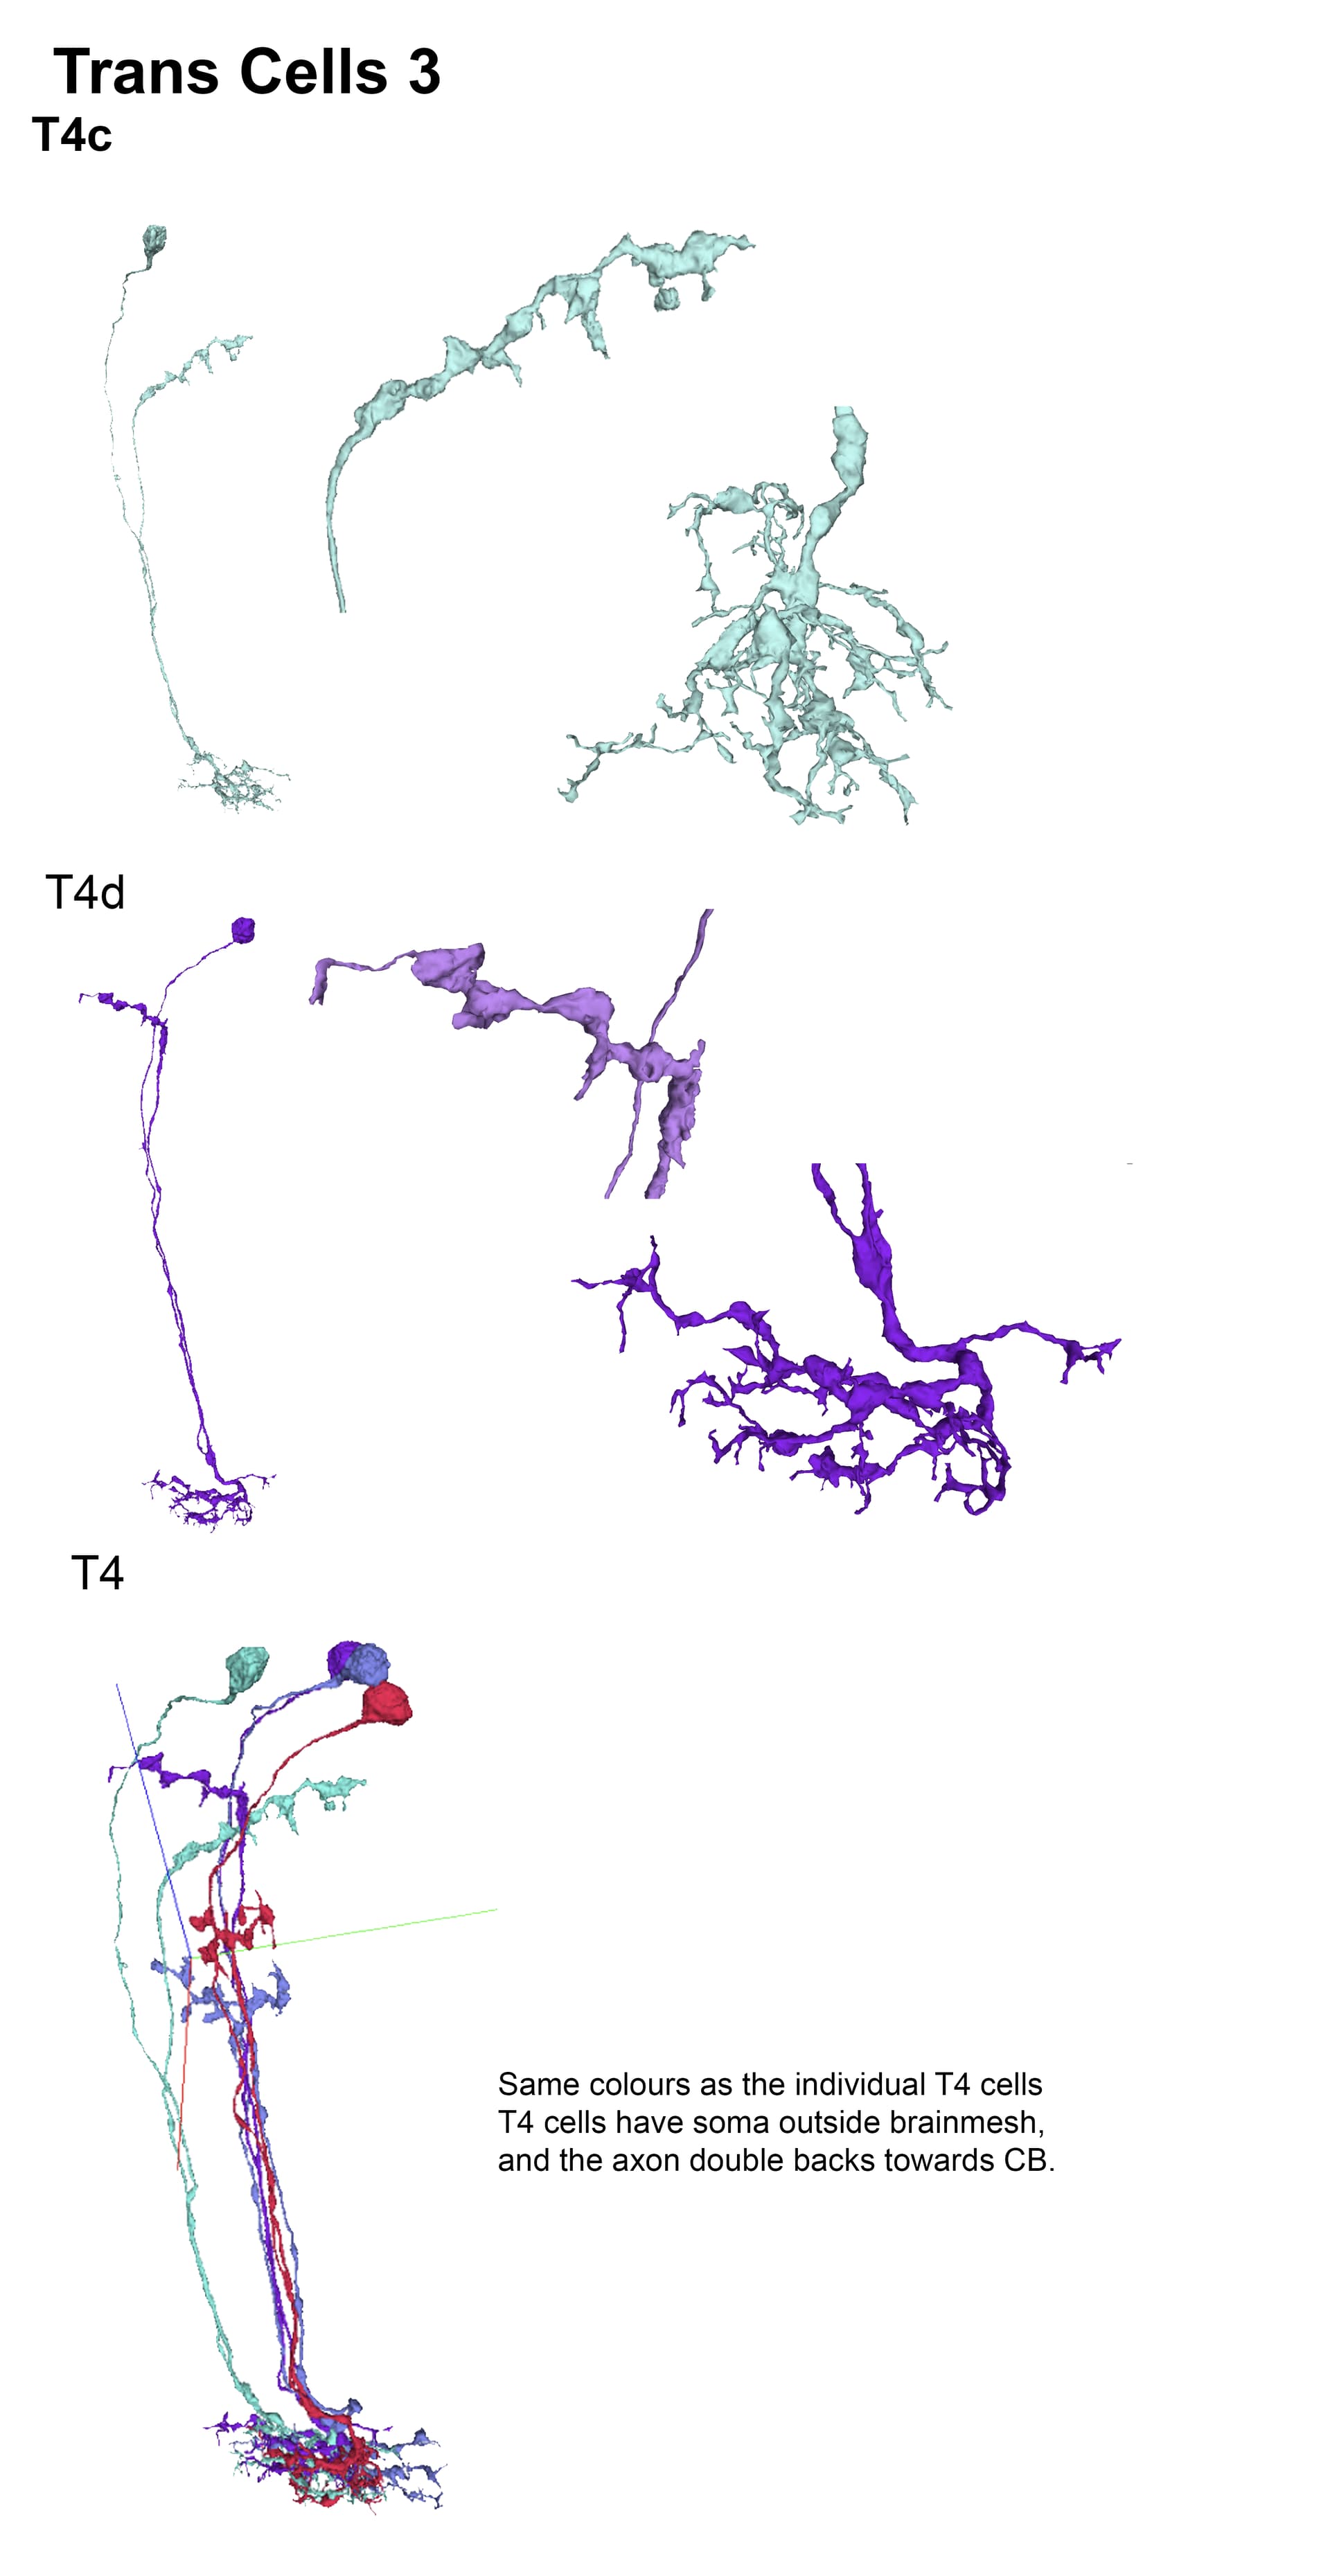
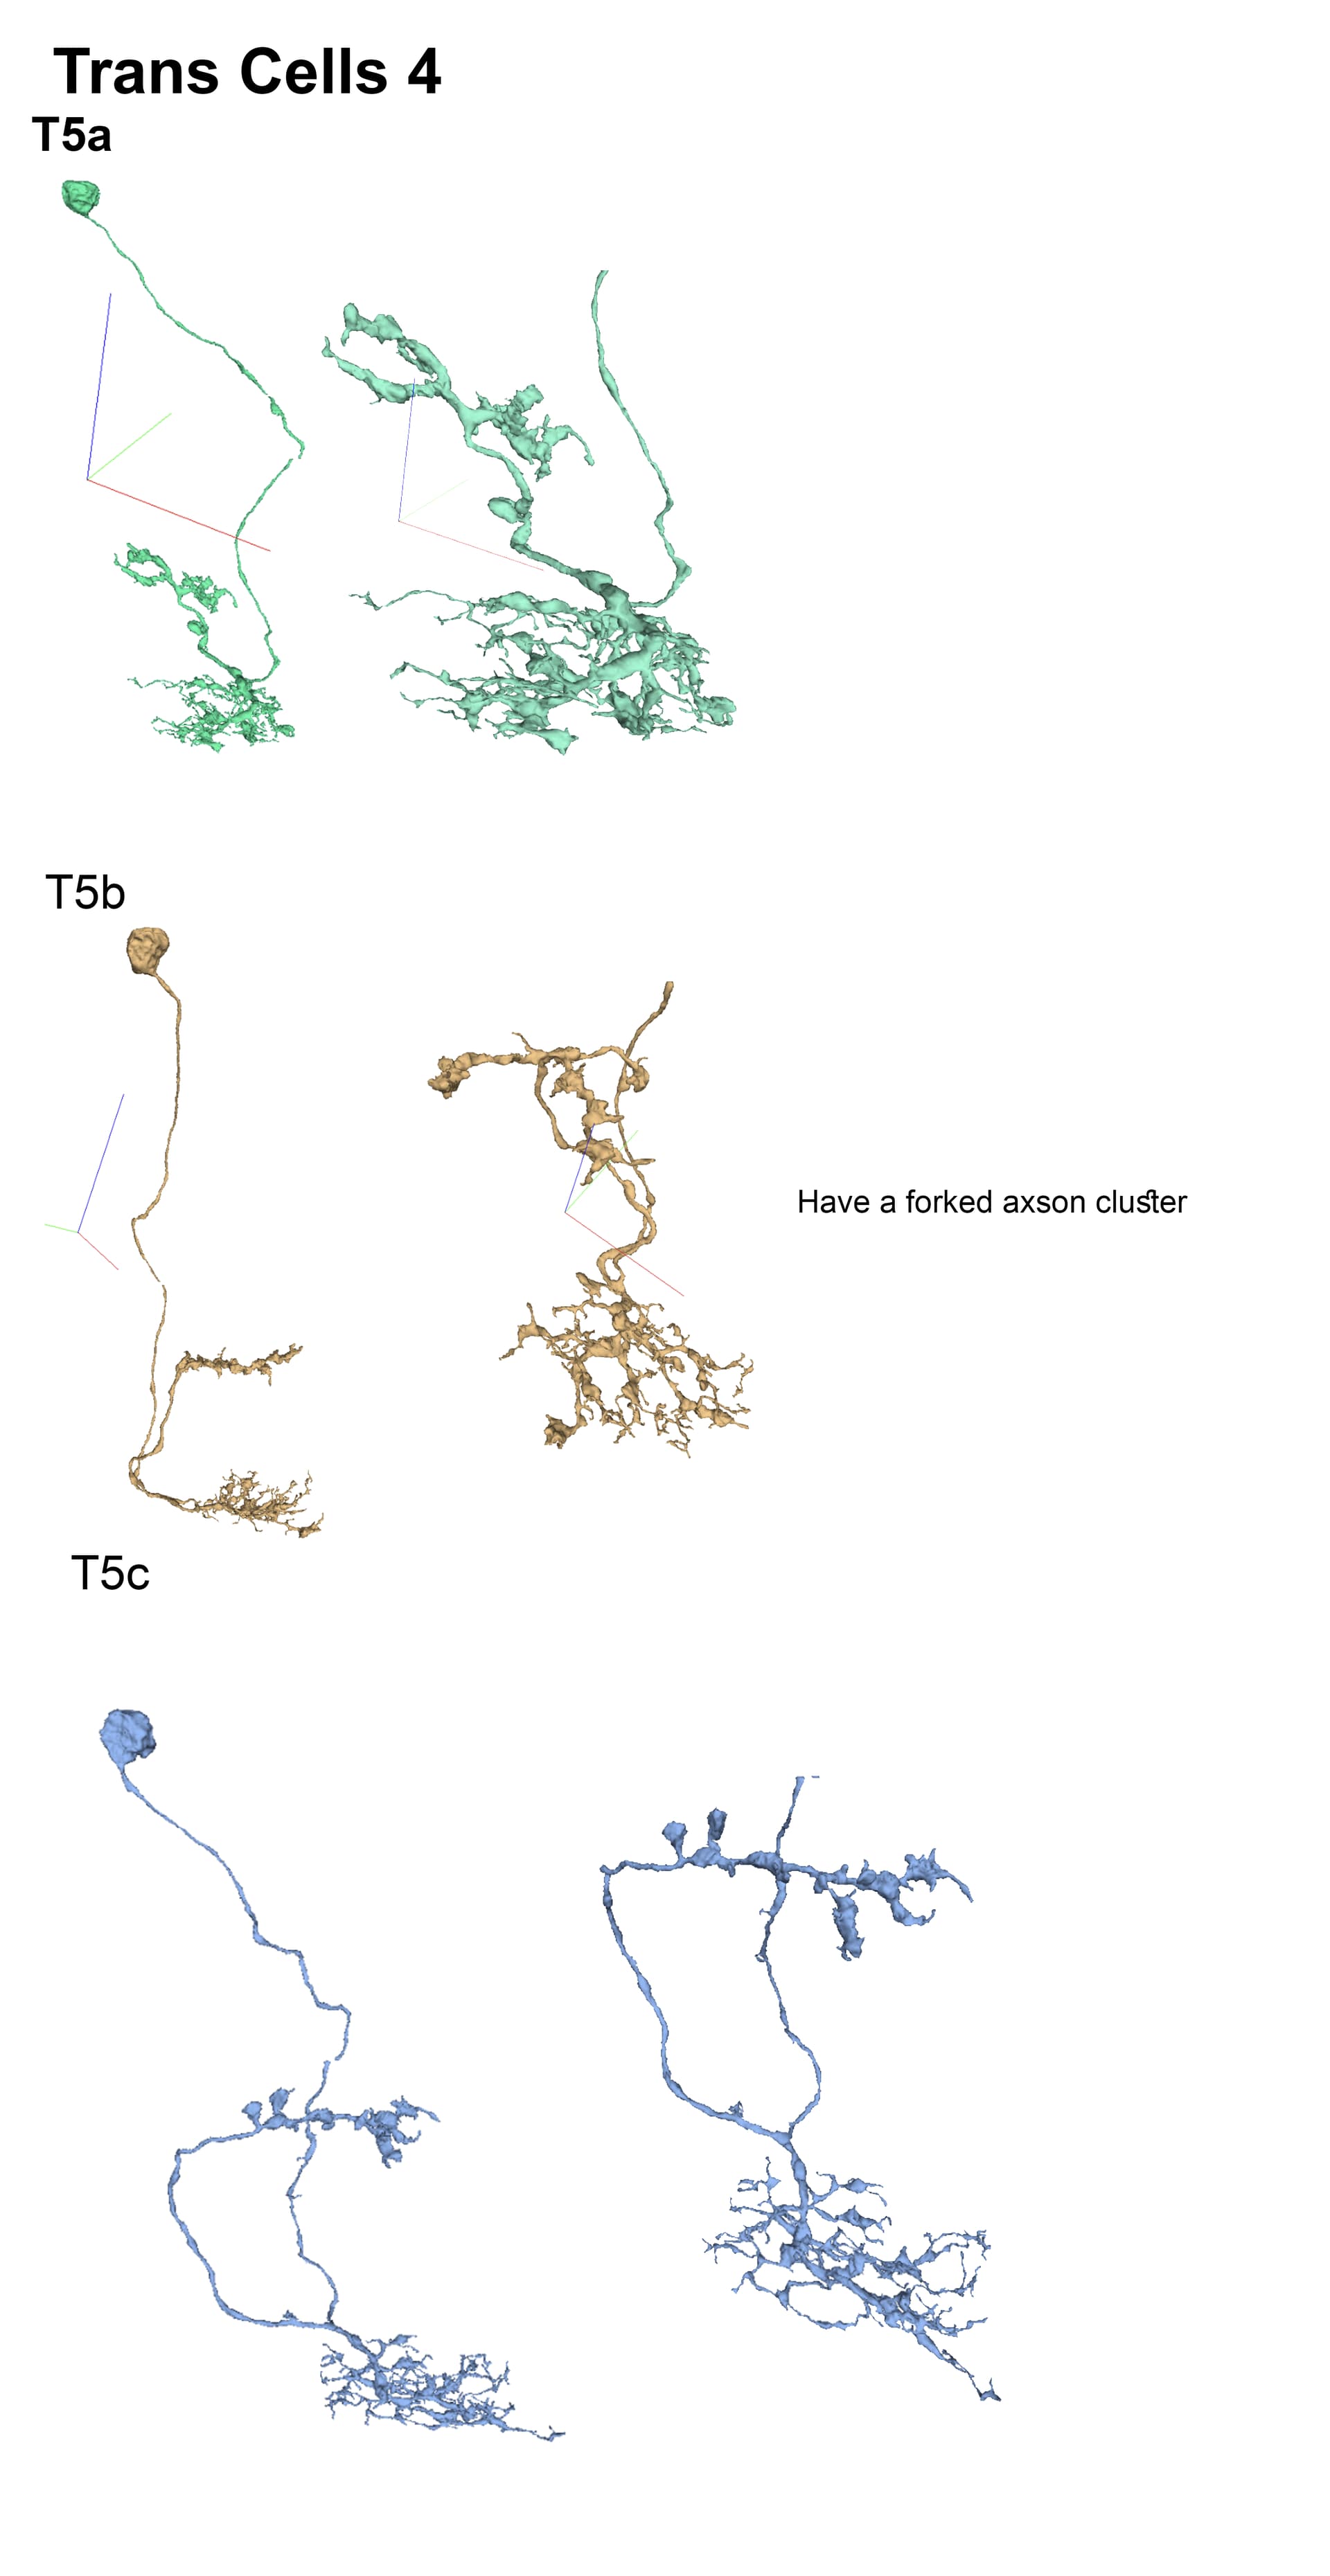
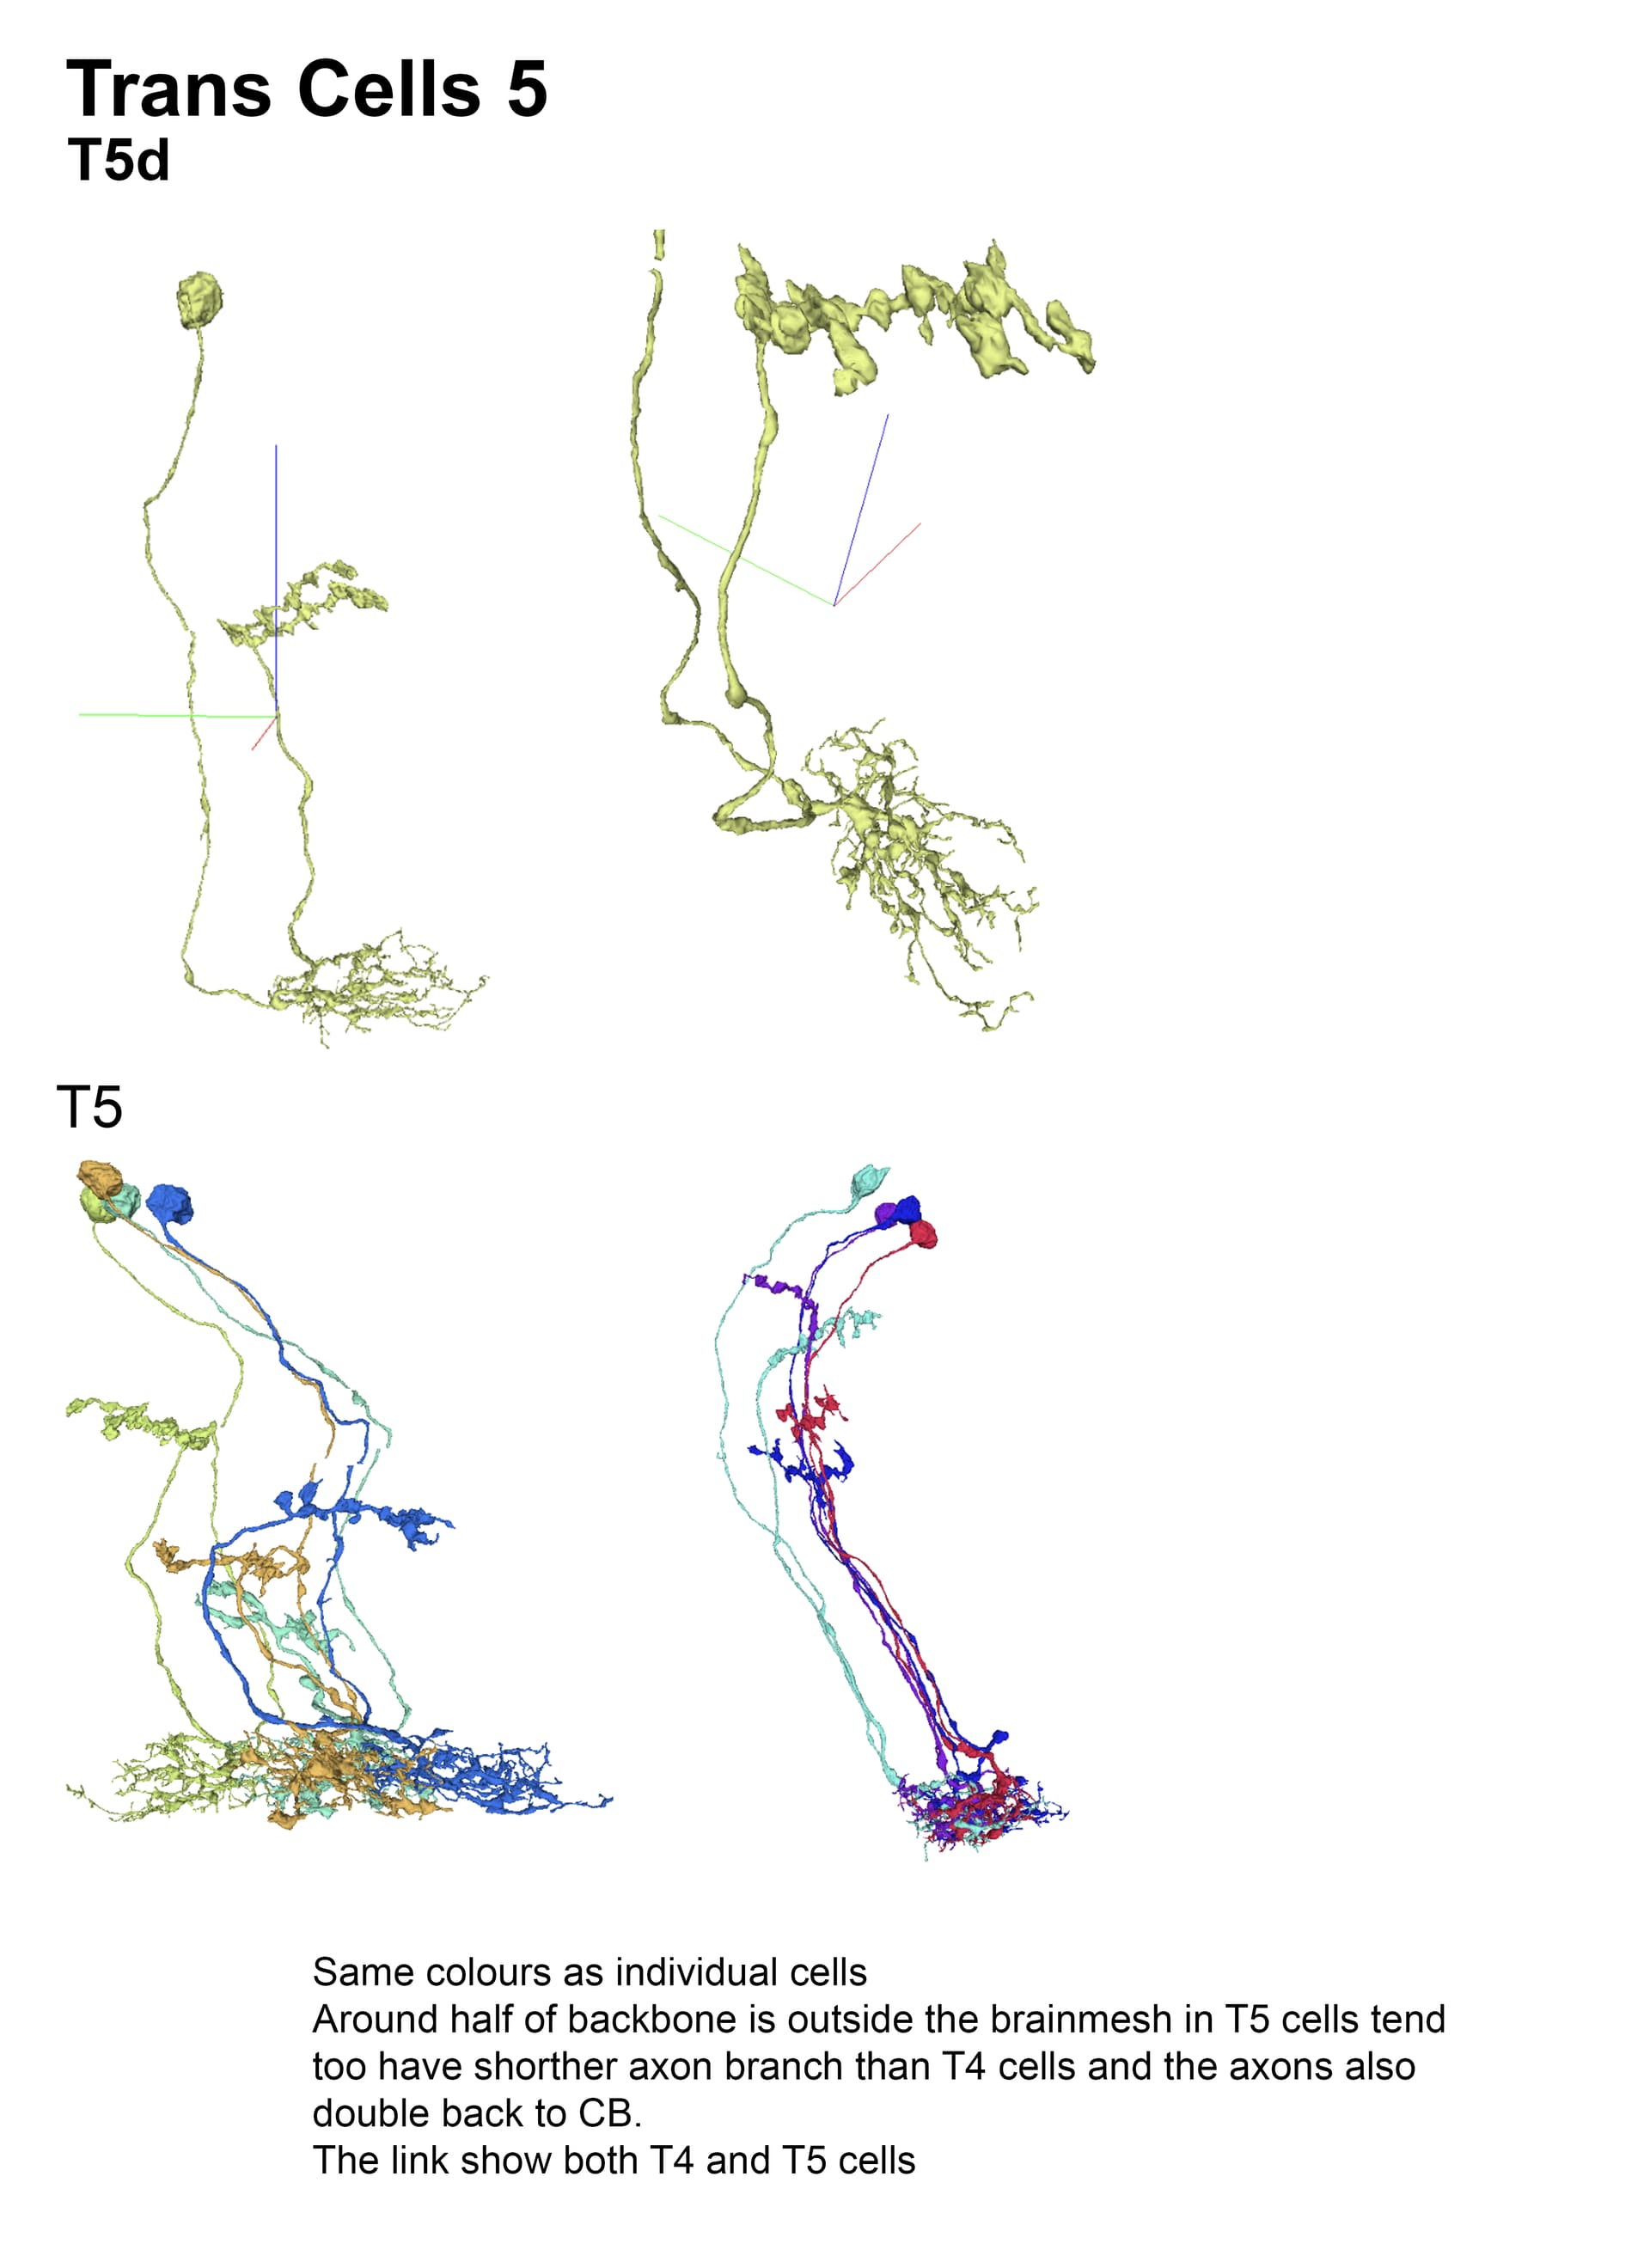
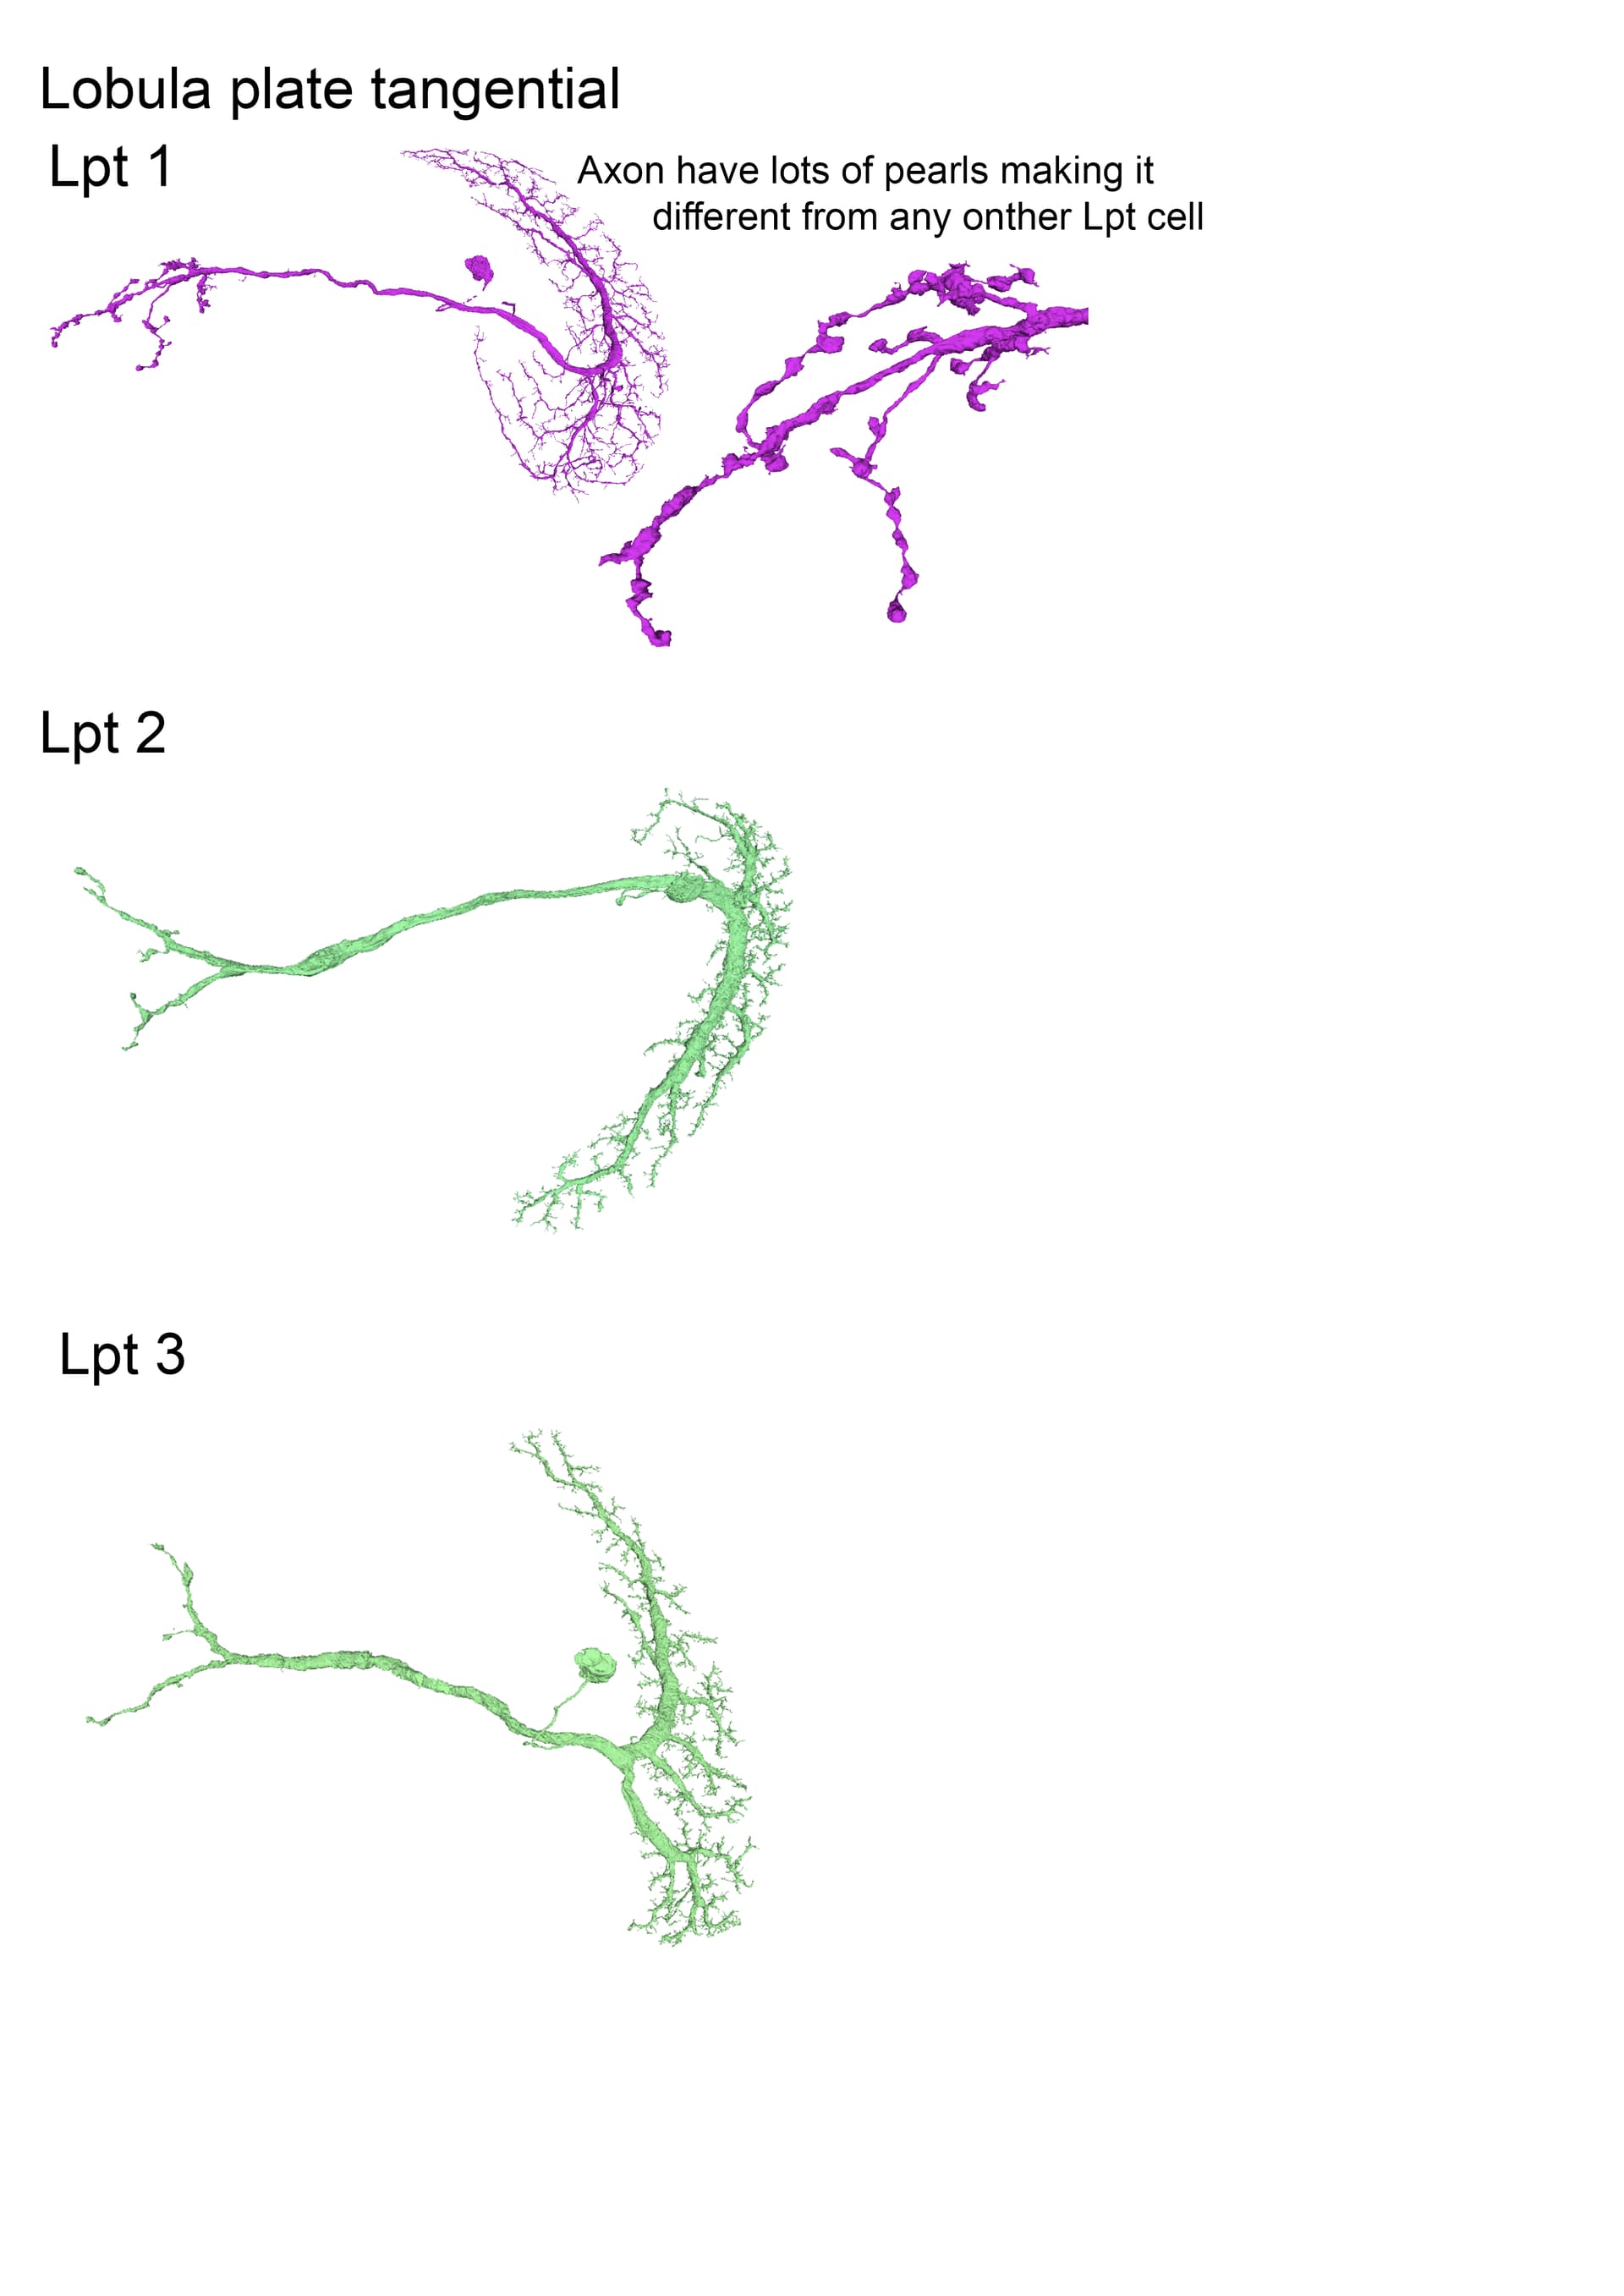
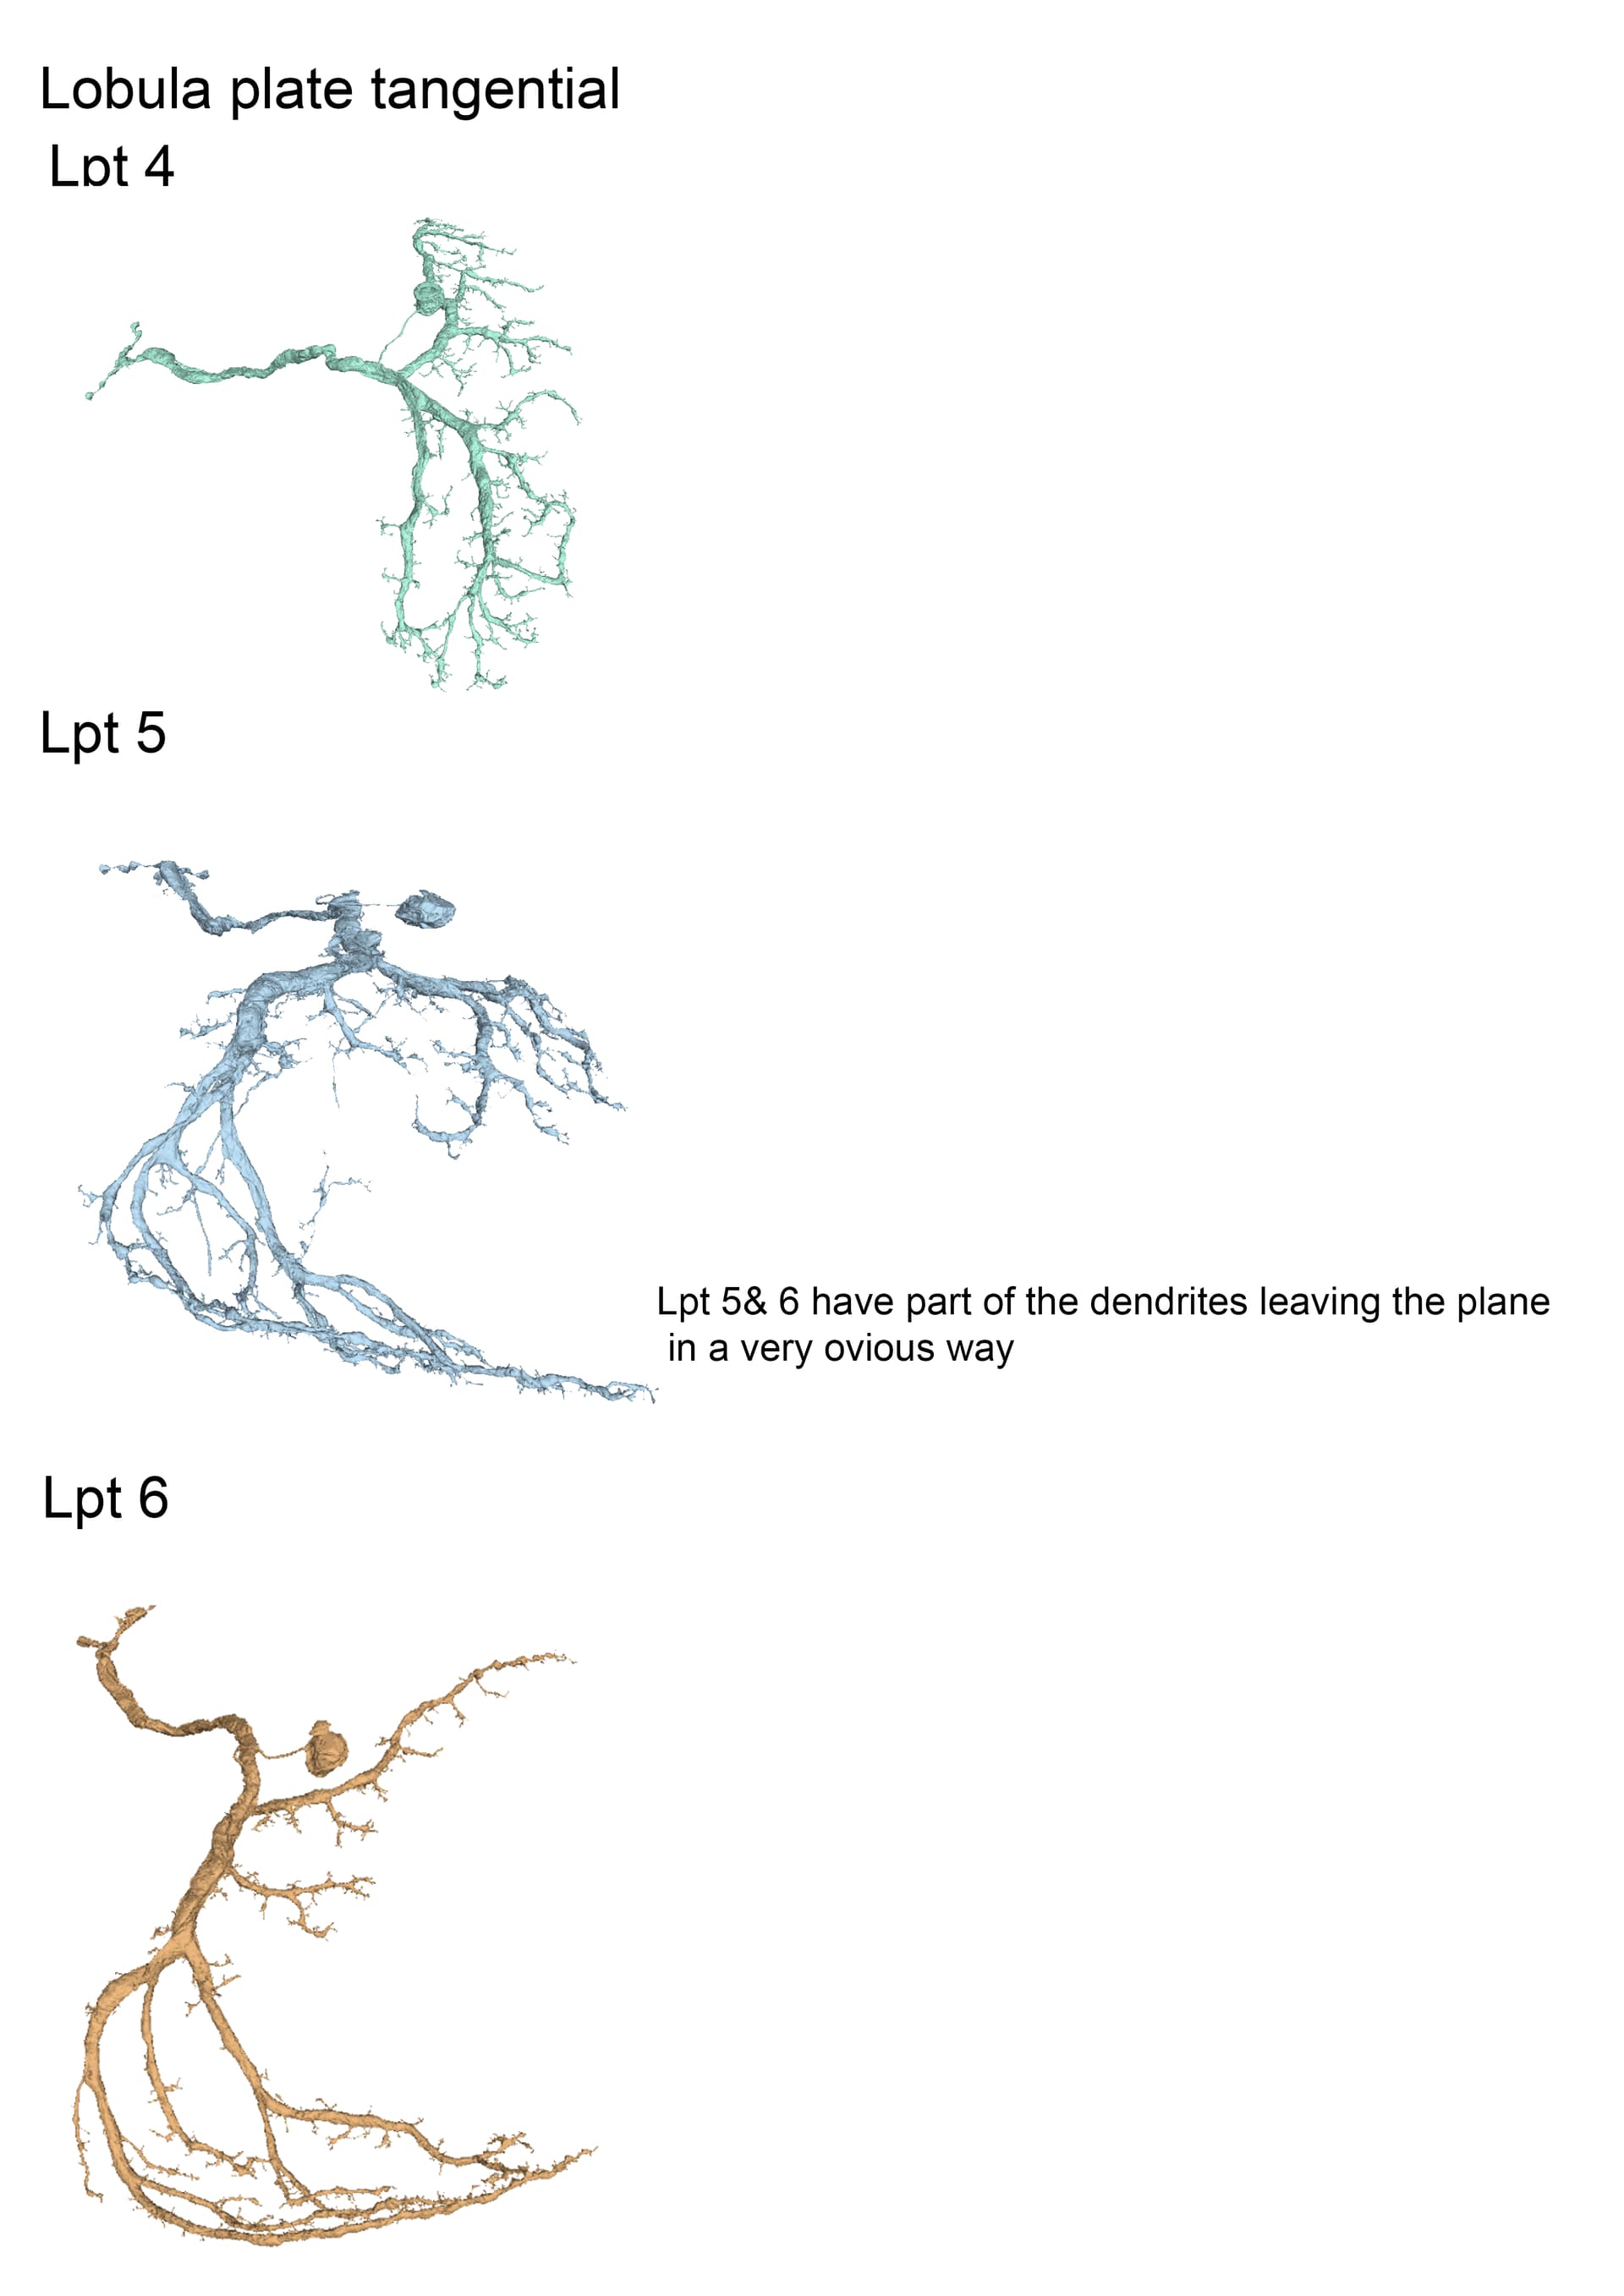
With the trans cells in gsheet finished here’s the illustrations: (I broke them up in 5 files so that 1 file wouldnt become non-printable by matter of resolution (ie: 200 x 40000 lol (bigger than A4))
Feel free to print etc away ![]()
These are finished as well, although I am not sure if we’ll get to identify any of these as I think they’ve already all been completed and identified by the lab ppl, but let’s have the visuals lol.
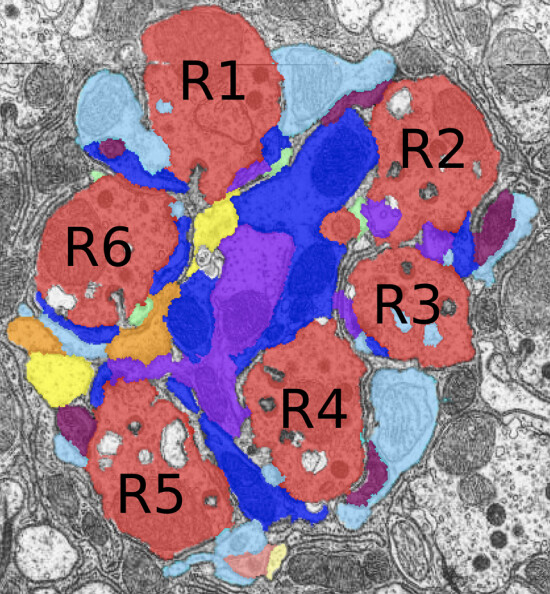
Q: Any way to tell R1 from other R# (other than 7/8s) in fw?
A: (From Emil Kind in youtube vid of yday’s symposium): “Very good question! It should be possible, but it is not trivial. The outer photoreceptors are arranged in each lamina cartridge according to a stereotyped pattern. This pattern is mirrored along the equator for the dorsal and ventral halves of the lamina. By identifying all outer PRs from a series of adjacent cartridges, one should be able to infer their R1-R6 fate.”
Keywords: Tmnew1, Tmnew2, Tmnew3, Tnew1, TmYnew1
Tmnew1 = ChaTmnew1,
Tmnew2 = ChaTmnew2,
Tmnew3 = ChaTmnew3,
Tnew1 = ChaTnew1,
TmYnew1 = ChaTmYnew1.
The other names are taken from FlyBase
Source: Neurons with cholinergic phenotype in the visual system of Drosophila - PubMed
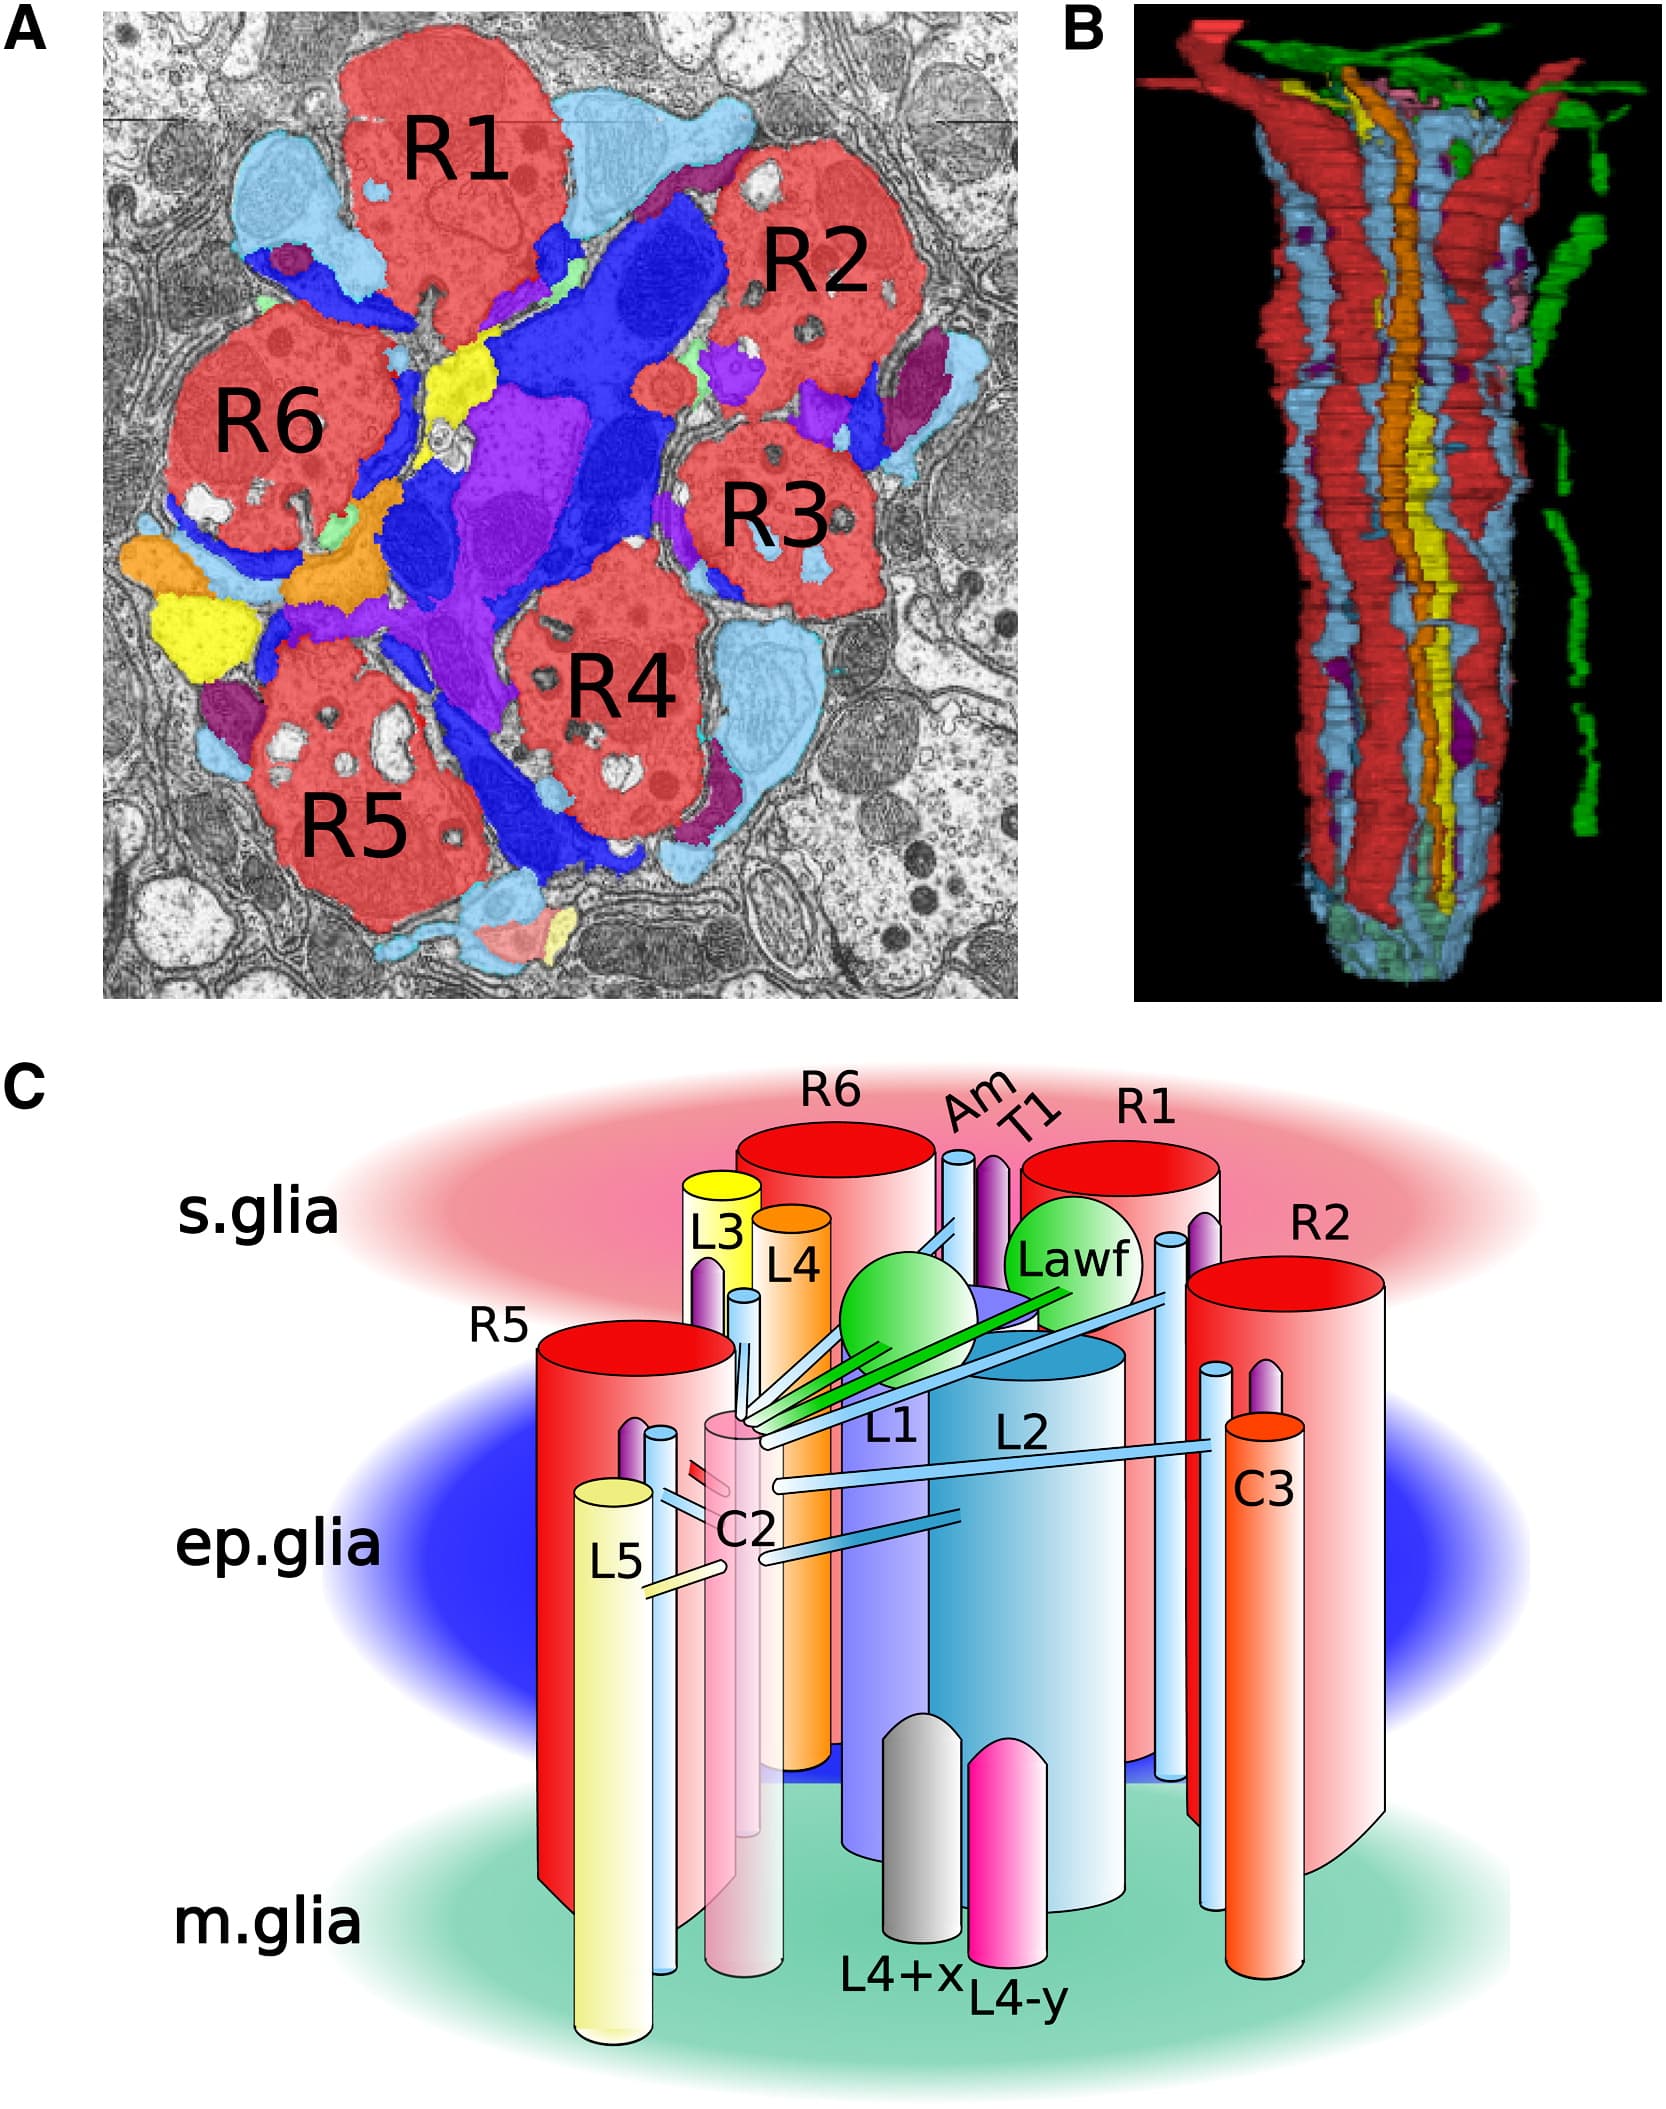
Figure 1. A Lamina Cartridge in Drosophila melanogaster Reconstructed in Three Dimensions from Serial Electron Microscopy Images
(A) Single electron microscopy (EM) image in which the cell profiles have been segmented and digitally labeled with different colors.
(B) Three-dimensional shapes of the neurons in the reconstructed cartridge; see Figure S1 for shapes of individual neurons.
(C) Schematic version of (B). Neurons connect with lateral branches, here illustrated for neuron C2. The following abbreviations are used: R1–R6, photoreceptors terminals 1 to 6; L1–L5, lamina monopolar cells 1 to 5; L4+x and L4−y, incoming L4 collaterals from the two neighboring anterior cartridges along the +x and −y axes, respectively; Am, amacrine cells; T1, T medulla neuron 1; C2 and C3, centrifugal medulla neurons C2 and C3; Lawf, lamina wide-field cells; ep. Glia, epithelial glia; s. glia, satellite glia; m. glia, marginal glia. To enable their visualization, we show only four of the six photoreceptors, five of the six T1 branches, five of the six amacrine vertical branches, and two of the 11 Lawf branches.
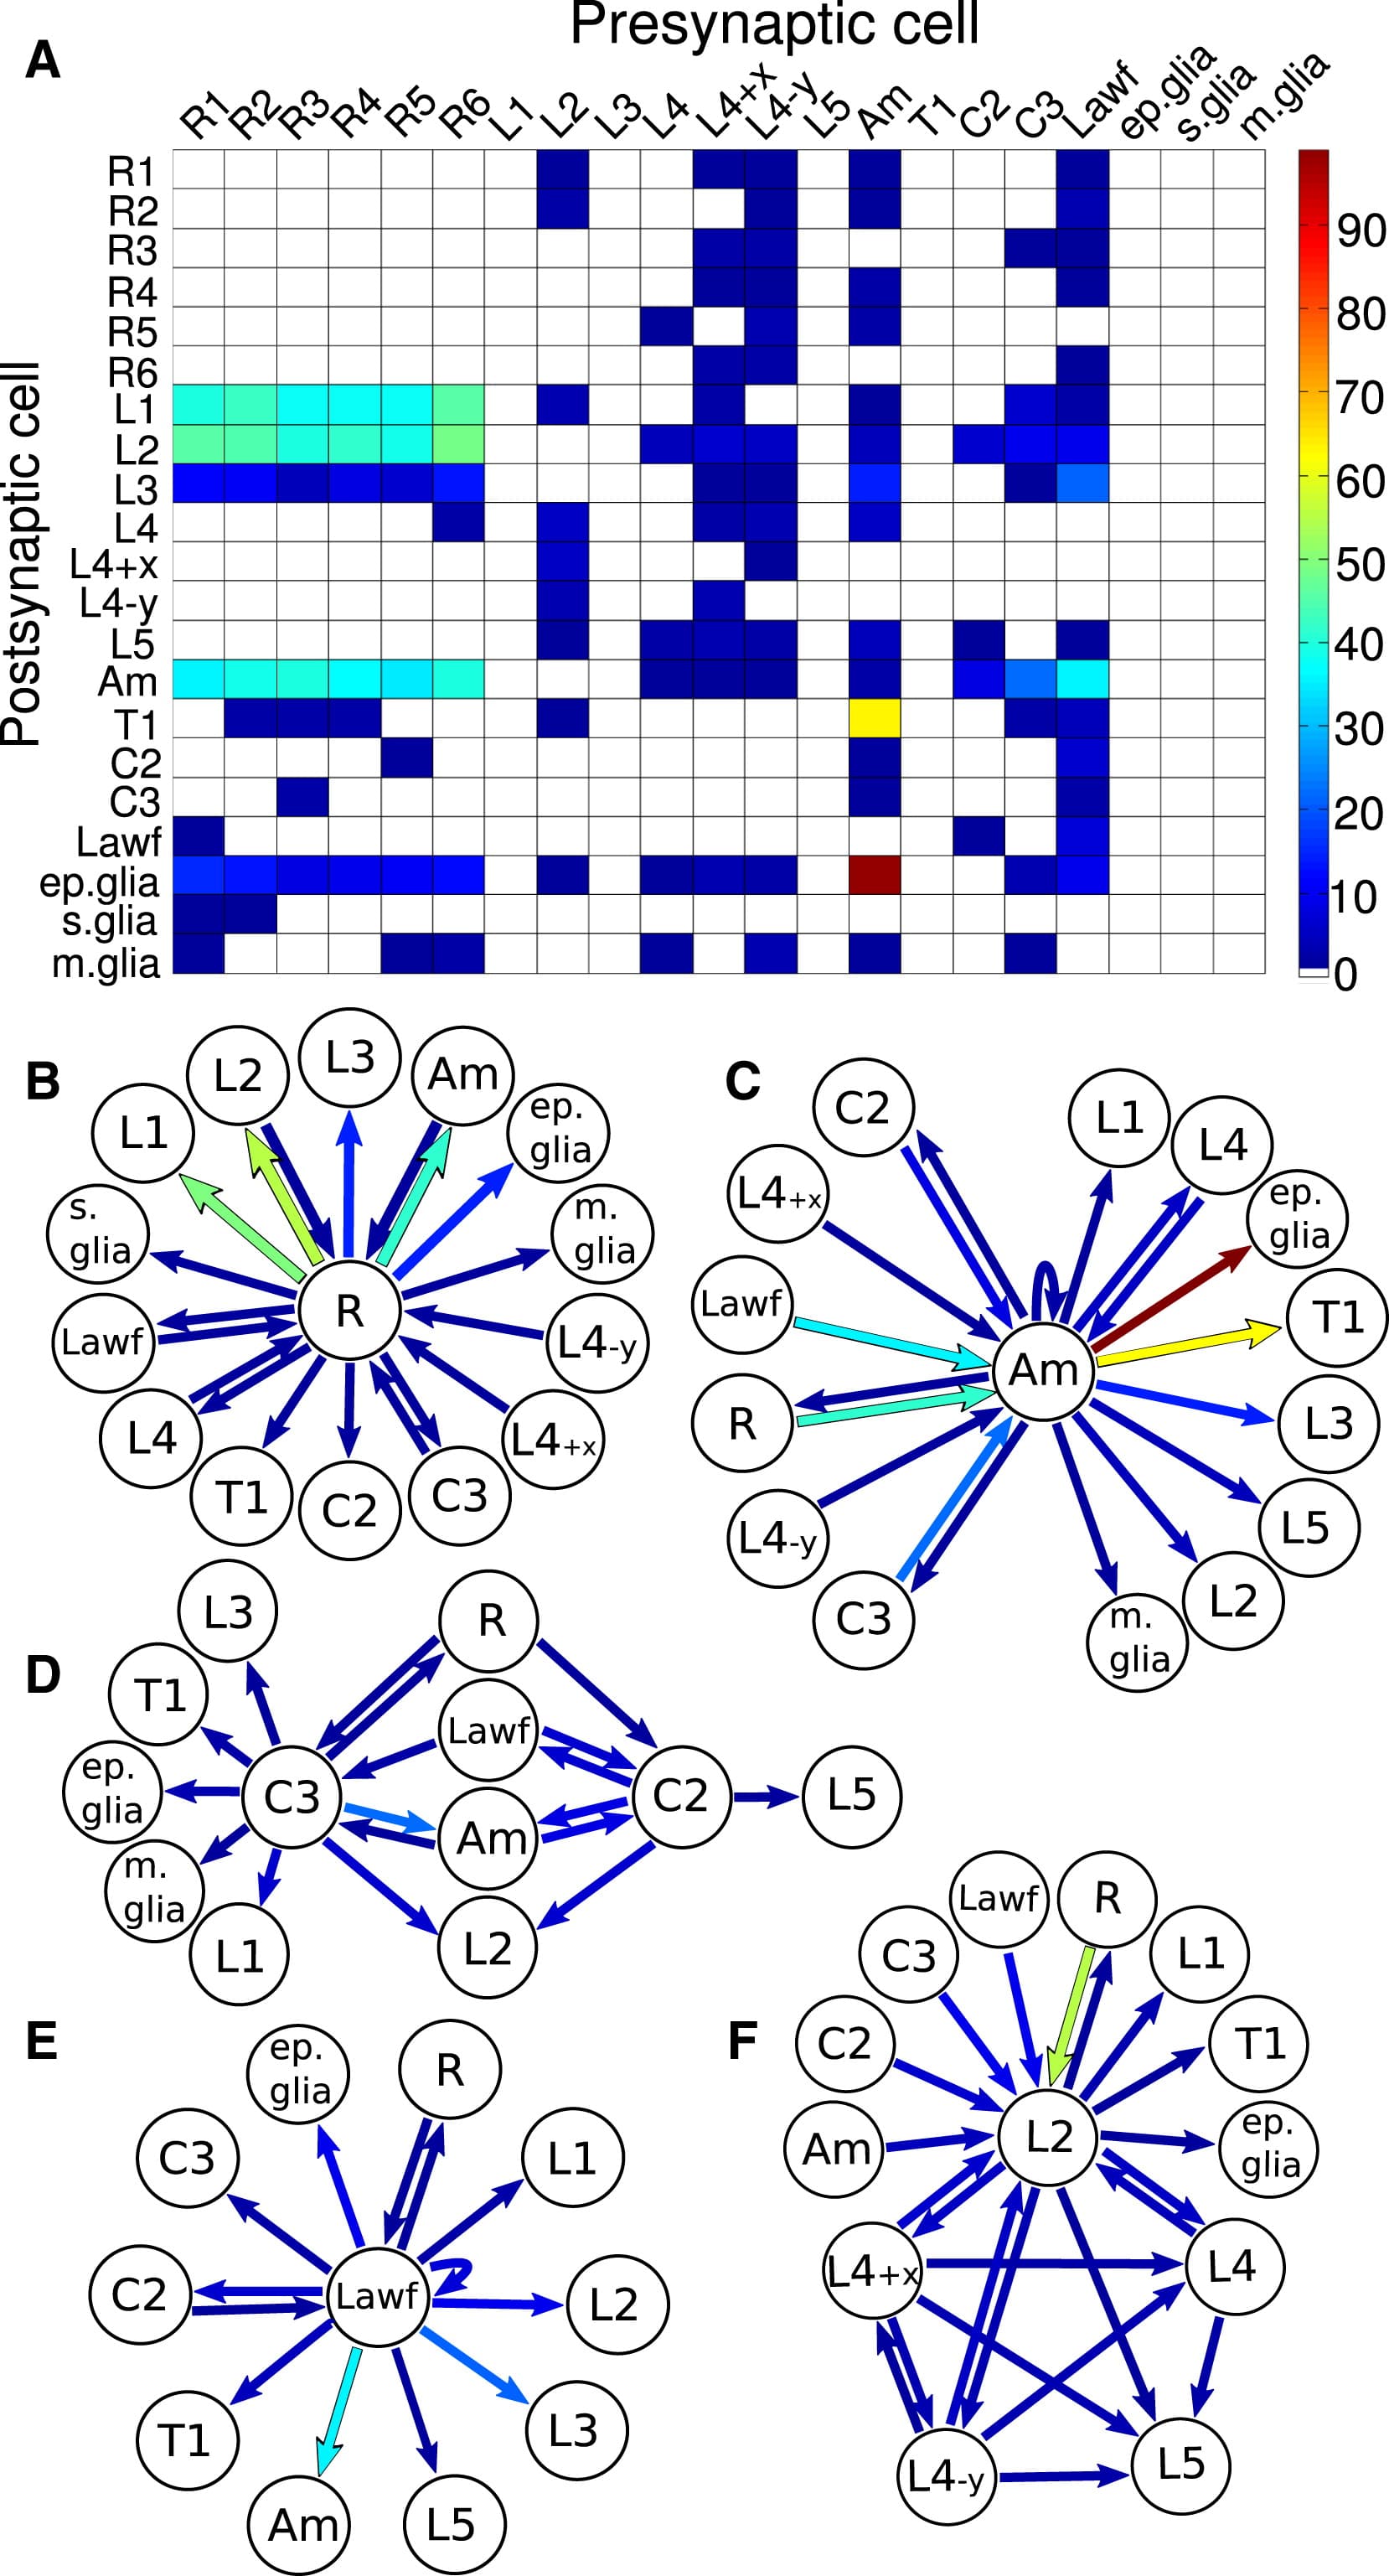
Figure 2. Connectivity in the Lamina Cartridge
(A) Connectivity matrix; see Table S1 for an extended matrix including neuronal subtypes and Table S2 for a numerical version. Hotter colors indicate a larger number of synapses.
(B–F) Representation of neurons and connecting neighbors for a photoreceptor (B), an amacrine neuron (C), centrifugal neurons C2 and C3 (D), a large wide-field neuron Lawf (E), and large monopolar cell L2 (F).
From Marta Rivera-Alba, Shiv N. Vitaladevuni, Yuriy Mishchenko, Zhiyuan Lu, Shin-ya Takemura, Lou Scheffer, Ian A. Meinertzhagen, Dmitri B. Chklovskii, Gonzalo G. de Polavieja,
Wiring Economy and Volume Exclusion Determine Neuronal Placement in the Drosophila Brain,
Current Biology,
Volume 21, Issue 23,
2011,
Pages 2000-2005,
ISSN 0960-9822,
https://doi.org/10.1016/j.cub.2011.10.022.
(Wiring Economy and Volume Exclusion Determine Neuronal Placement in the Drosophila Brain - ScienceDirect)
T4, T5 and their synaptic partner neurons.
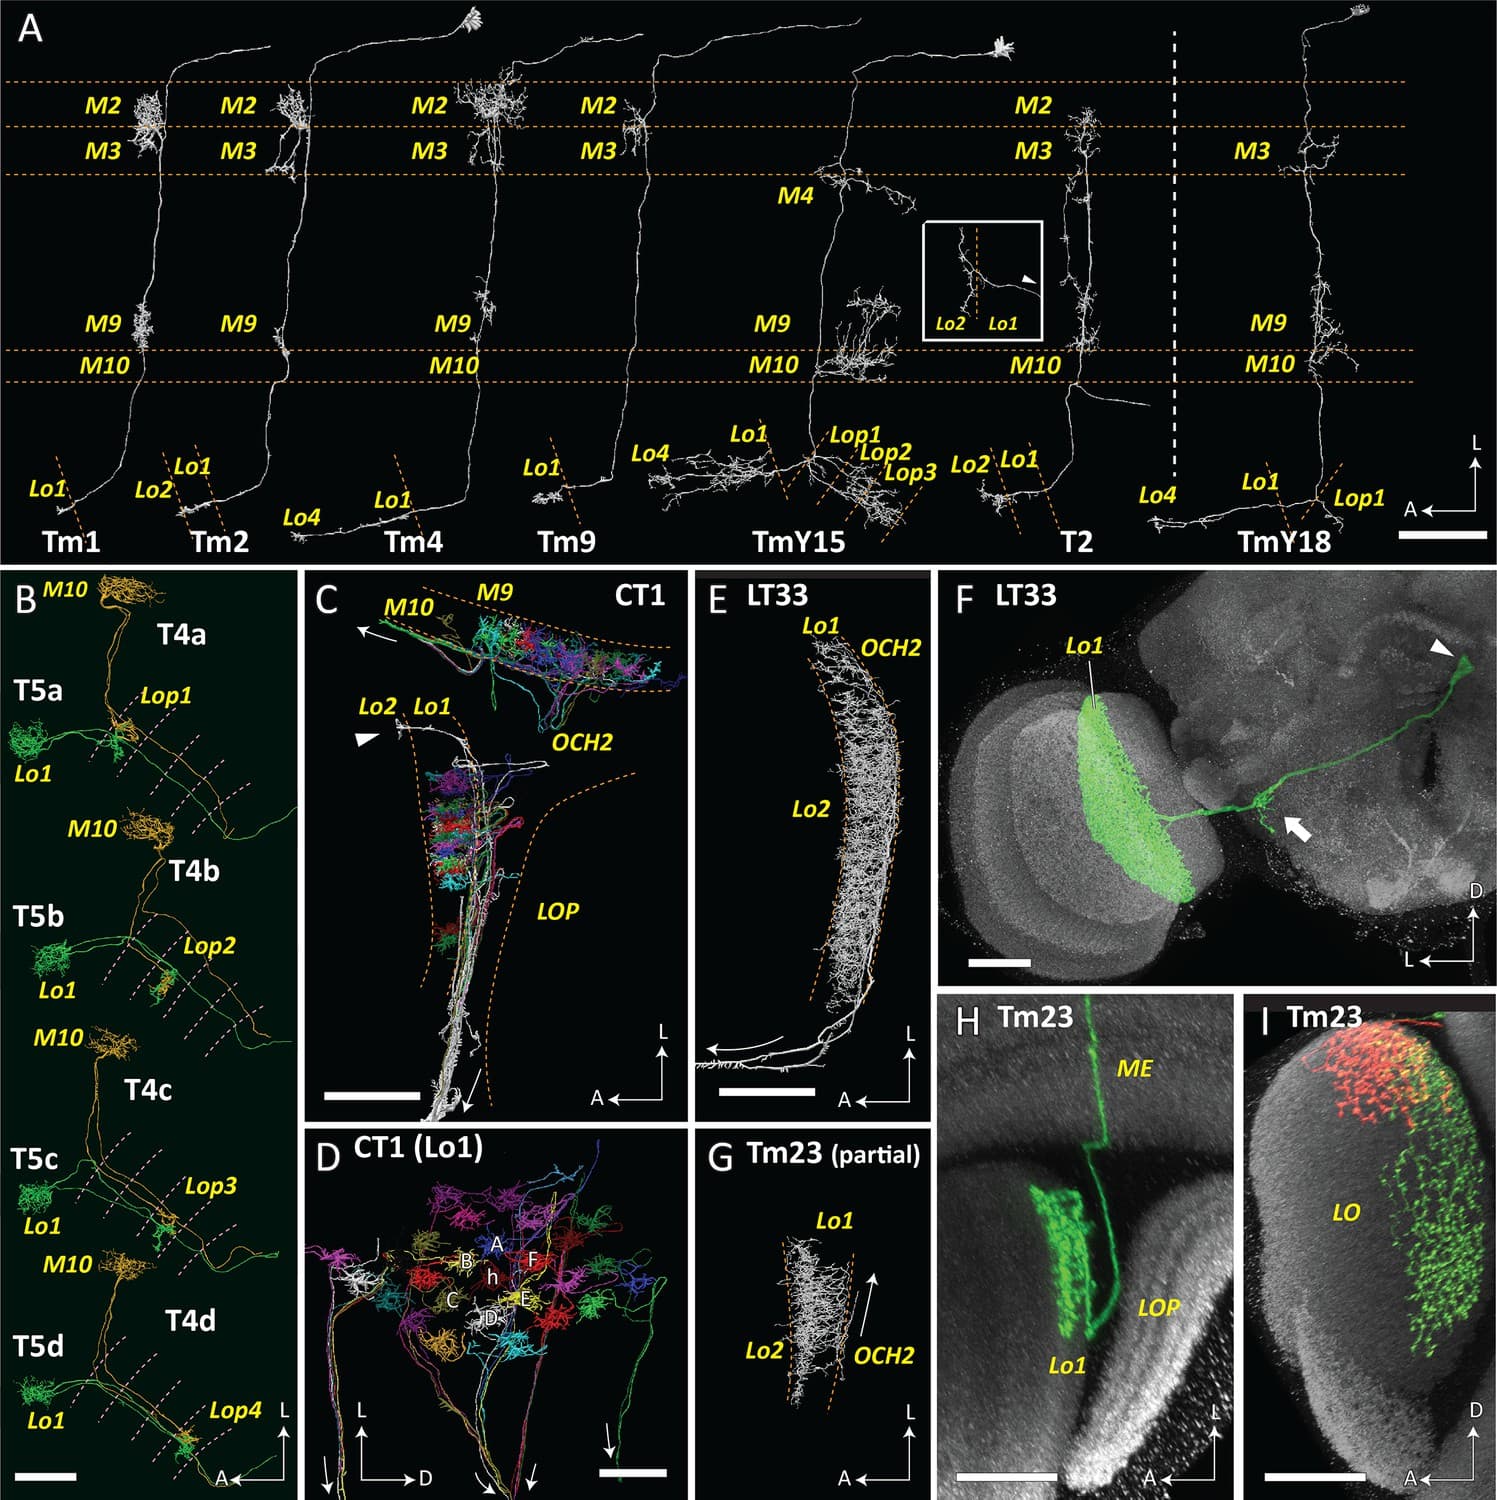
(A) T5 forms synaptic contacts with Tm1, 2, 4, 9, TmY15 and T2 cells. T4 is presynaptic to a newly identified TmY18 cell in M10. These synaptic partners of T5 and T4 have cell bodies in the medulla cortex distal to stratum M1, except T2 has a soma between the medulla and lobula. Tm and T2 cells receive inputs mainly in the medulla and project to the lobula, whereas TmY cells project to both the lobula and the lobula plate. All reconstructed cell profiles closely capture the profiles of those reported from Golgi impregnation (Fischbach and Dittrich, 1989) except the lobula terminal of T2 (inset), shown here from a different angle (lateral view, arrowhead indicates the outgoing fiber connected to the medulla and cell body). (B) Paired T4 and T5 cells. T4/5a, b, c, and d cell pairs project to the lobula plate, to strata Lop1, 2, 3 and 4, respectively. Their cell bodies are located in the lobula plate cortex, posterior to the lobula plate. (C, D) Parts of CT1 reconstructed in both the medulla and lobula reveal the morphology of its color-coded columnar terminals. Fibers connecting the terminals enter the second optic chiasm (OCH2) before exiting the optic neuropils (trajectories shown by arrows). Most branches terminate in medulla stratum M10 or lobula stratum Lo1, but a few terminals project deeper, into Lo2 (arrowhead in (C)). Columnar terminals in Lo1 corresponding to a home (h) column and the surrounding six columns (A–F) are indicated in (D). (E) A partial reconstruction of LT33, a novel neuron in lobula stratum Lo1. (F) Optic lobe and central brain projection pattern of an LT33 cell visualized using multicolor stochastic labeling (MCFO; see Materials and methods). The arrowhead indicates the cell body, and the arrow shows the site of branching in the posterior lateral protocerebrum. (G) Partial reconstruction of Tm23 in stratum Lo1. (H, I) Tm23 cells and their projection patterns in the optic lobe visualized using MCFO. Images show two different views generated from the same confocal stack. Images in (F), (H), and (I) show resampled views generated from confocal stacks using Vaa3D. For clarity, the images in (F) and (H) were segmented to omit additional labeled cells (distinguished by labeling color and position) that are also present in the displayed volume. In (I), red and green signals each represent single Tm23 cells. Scale bars: (A) 20 μm; (B), (C), (E), (G) 10 μm; (D) 5 μm; (F), (H), (I) 20 μm.
Citation:
Kazunori Shinomiya, Gary Huang, Zhiyuan Lu, Toufiq Parag, C Shan Xu, Roxanne Aniceto, Namra Ansari, Natasha Cheatham, Shirley Lauchie, Erika Neace, Omotara Ogundeyi, Christopher Ordish, David Peel, Aya Shinomiya, Claire Smith, Satoko Takemura, Iris Talebi, Patricia K Rivlin, Aljoscha Nern, Louis K Scheffer, Stephen M Plaza, Ian A Meinertzhagen (2019) Comparisons between the ON- and OFF-edge motion pathways in the Drosophila brain eLife 8:e40025
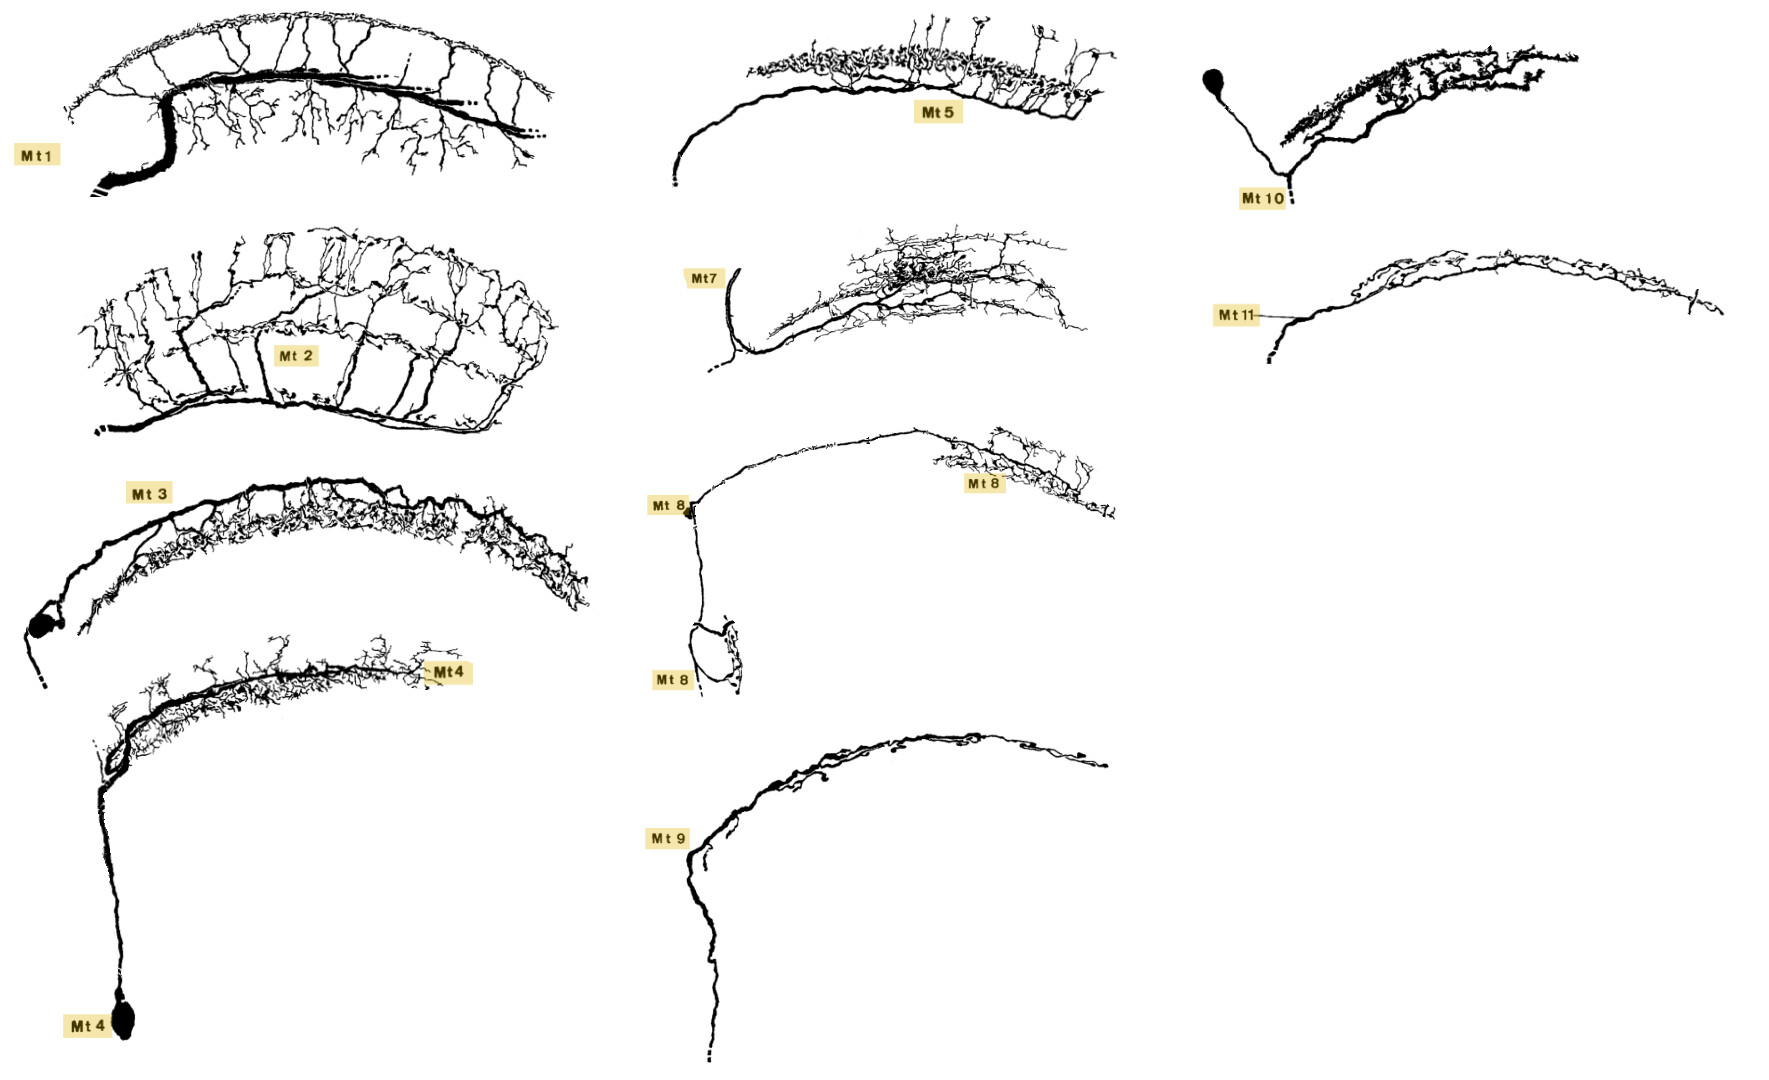
I have problems with identifying all the Mt cells. Especially, that they are spreaded all over the Fischbach’s paper. So I’ve decided to put them all in one place and remove all the other cells and layers from the picture. Here is the result:
There’s missing Mt6, because it isn’t in the paper as a sketch. It is in the further part of the document, but only as a not very clear microscophic photo. There also photos of Mt13, Mt14 and Mt15, but all harder to guess their shape.
FlyBase informs about 4 other Mts, all identified by their neurotransmitters.