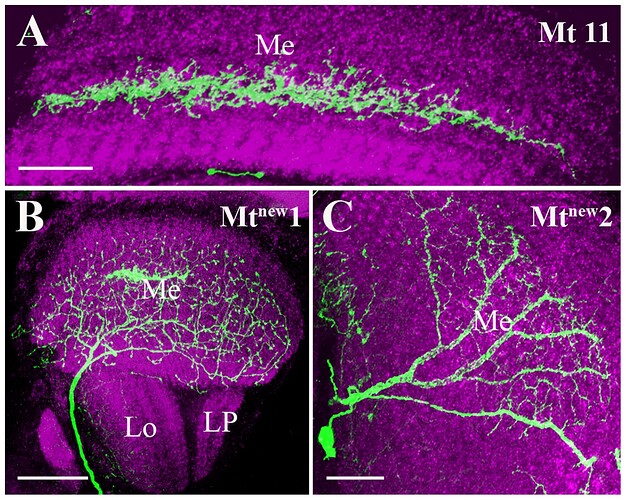
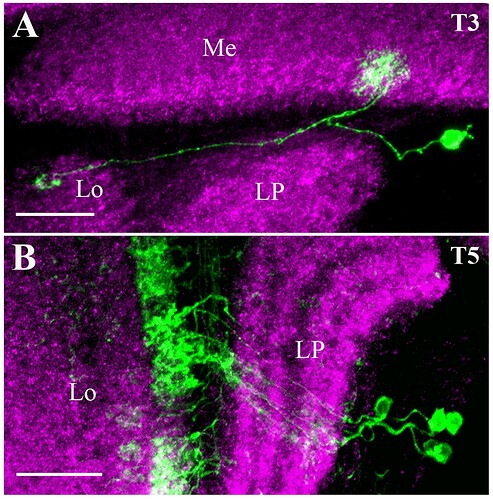
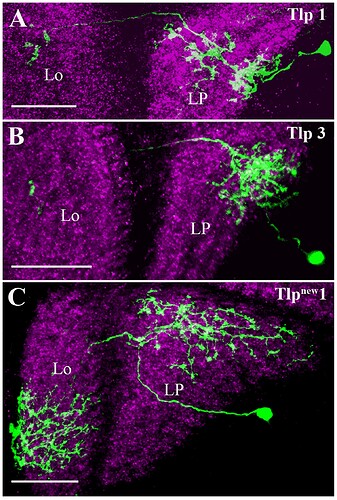
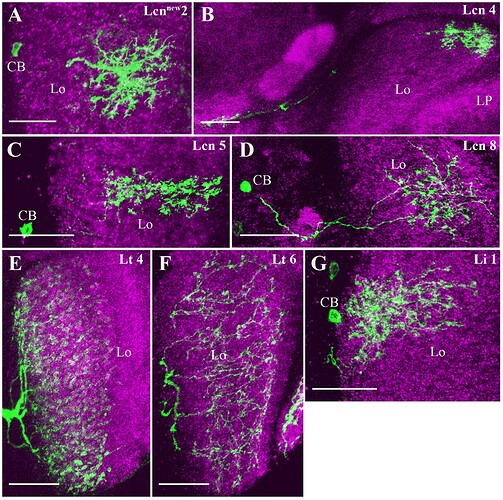
Got a big collection here from a single paper (sourced at the end of the post), primarily focused on the lobula plate, T4, T5, LPi, and new types of TmY, Y, and Tlp. Along with some connectivity for those of you interested!
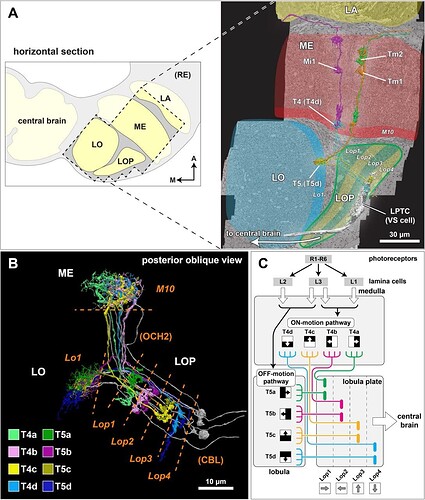
EM reconstruction of the synaptic partners of T4 and T5 cells in the lobula plate.
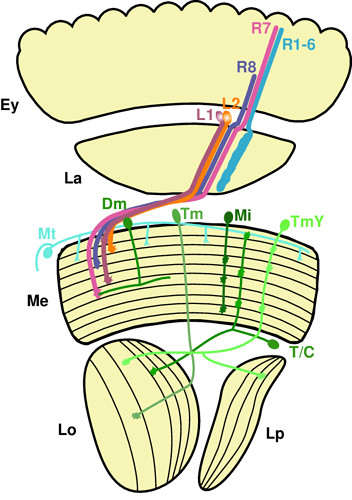
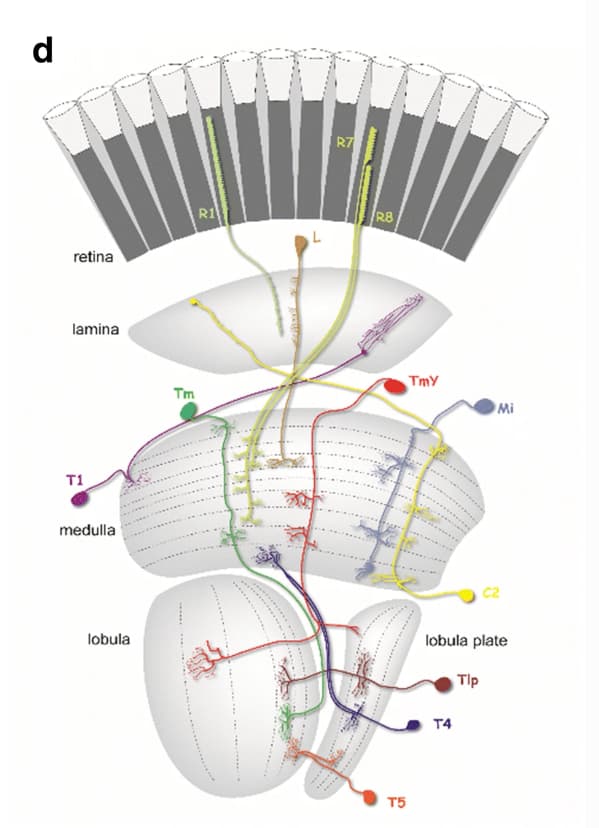
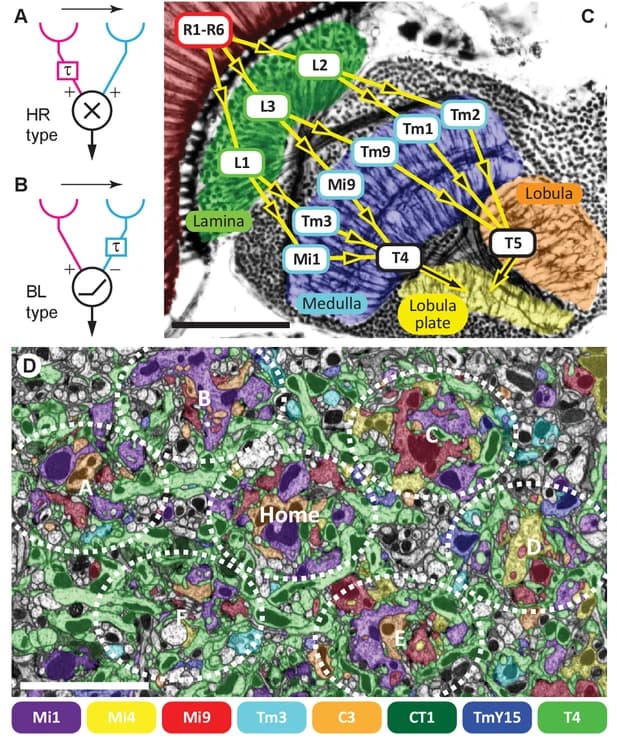
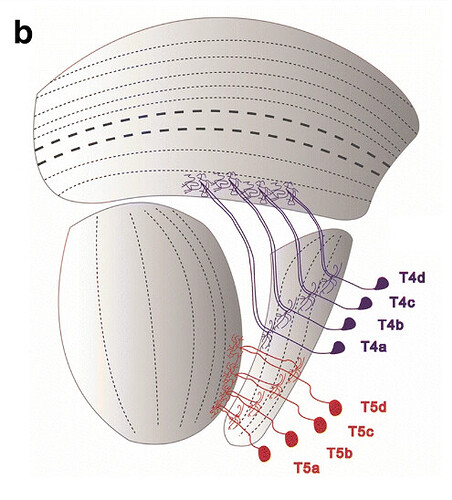
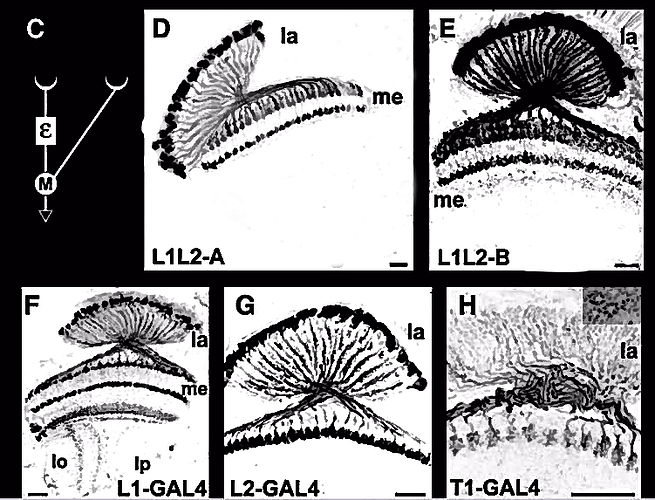
(A) The optic lobe FIB-SEM dataset covers a subvolume of the medulla (ME), lobula (LO), and lobula plate (LOP), as well as the proximal part of the lamina (LA), selected to contain many connected neurons of the motion pathway. The data set was imaged with voxel size x = y = z = 8 nm, and the size of the image stack is 19,162 × 10,657 × 22,543 pixels, equivalent to 153 μm x 85 μm x 180 μm 22. In the right panel, representative neurons in the ON- and OFF-motion pathways in the medulla and the lobula, as well as a lobula plate tangential cell (VS cell) are shown (panel adapted from Shinomiya et al. 22). M: medial, A: anterior. (B) Subtypes of the T4 and T5 cells. The T4 cells receive inputs onto their dendrites in medulla layer 10 (M10), T5 neurons receive dendritic input in lobula layer 1 (Lo1). Both cell types project through the non-synaptic second optic chiasm (OCH2) and stratify into the four layers of the lobula plate (Lop1-Lop4). The cell bodies are located at the cell body layer (CBL) in the lobula plate cortex. The cell bodies and the cell body fibers are shown in gray, while some cell bodies are not shown. (C) A schematic diagram of the motion circuit. Local luminance is detected by the photoreceptors R1-R6 in the retina. The signals are relayed to the lamina cells (L1, L2, and L3), which send outputs to various columnar cells in the medulla (not detailed here). The 4th order T4 and T5 neurons integrate inputs from the ON and OFF motion pathway neurons, respectively, and project to the lobula plate. The four subtypes (a, b, c, and d) detect visual motion in the front-to-back, back-to-front, upward, and downward directions, respectively, and project axons to the corresponding LOP layer where these directionally selective signals are integrated by lobula plate neurons.
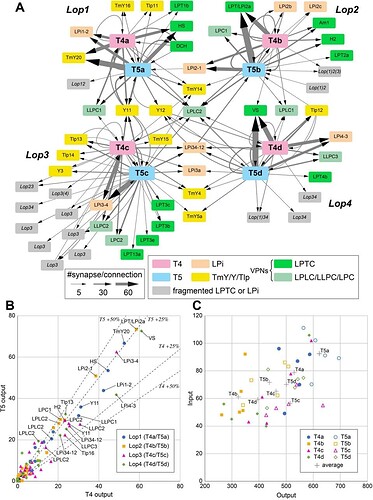
Connectivity of the seed T4 and T5 cells in the lobula plate.
(A) The inputs and outputs of representative T4 and T5 cells (five cells per each subtype; see text for details, also File S1) in the lobula plate were comprehensively identified. The input and output cells were grouped by the cell type, and inputs and outputs corresponding to a mean of more than five synapses per T4 or T5 cell are shown in the diagram. The thickness of the arrows indicates the average number of synapses per T4 or T5 cell. Each rectangle indicates a cell type; colored rectangles correspond to uniquely identified cells, and gray rectangles represent neurons we could not uniquely identify due to incomplete reconstruction. For unidentified neurons, the main innervated layers are shown in italic letters. For example, Lop(1)34 means that the fragment has major arbors in Lop3 and Lop4, and minor arbors in Lop1. LPi are lobula plate intrinsic cells, the TmY/Y/Tlp neurons connect the optic lobe neuropils, and LPTC and LPLC/LLPC/LPC cells are visual projection neurons (VPNs) that send outputs to the central brain. (B) Average numbers of output synapses from single T4 and T5 per postsynaptic cell type. Neurons are color-coded by the layer where they receive inputs from T4 and T5. Generally, outputs from T4 and T5 (and therefore inputs to their target neurons) are approximately evenly integrated by the postsynaptic cells, with a slight bias for T5. All named neurons receiving more than an average of 20 synapses from both T4 and T5 are labeled (LPLC2 is labeled for all four layers). The dashed lines indicate 25% and 50% difference from equal numbers of output from T4 and T5 to any target cell type. (C) Total numbers of input and output synapses of the representative T4 and T5 cells. Autapses (self-synapses) and synaptic contacts with glia are excluded from this quantification. Averaged synapse numbers of each cell type (five individual neurons per each cell type) are indicated as gray crosses.
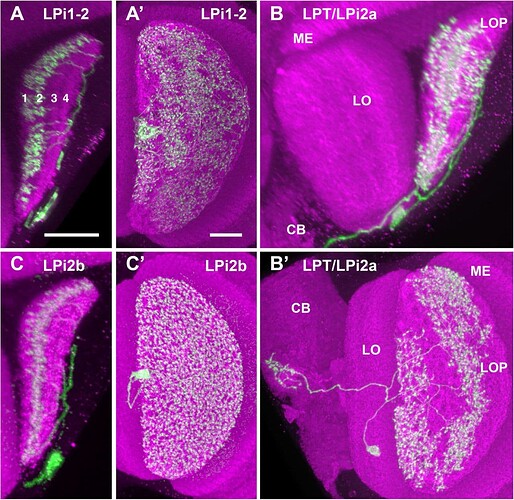
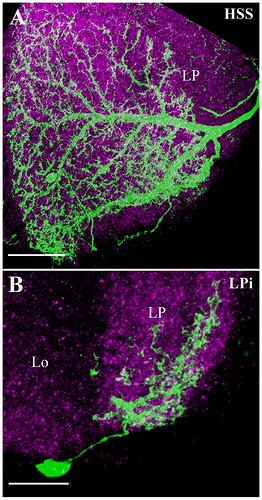
Candidate light microscopy matches for large LPi-like cells. Related to Figure 6.
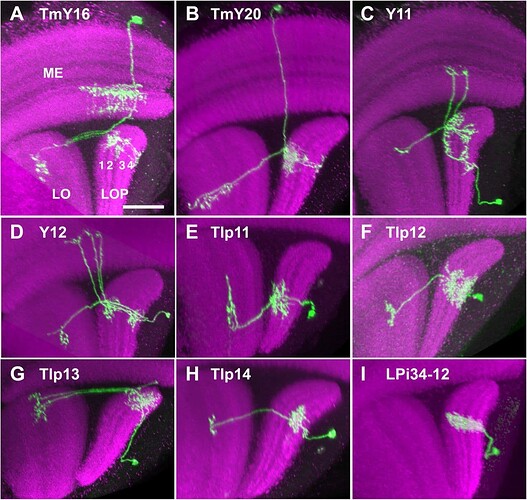
Candidate light microscopy matches for newly described optic lobe intrinsic cell types. Related to Figure 6. (A) TmY16, (B) TmY20, (C) Y11, (D) Y12, (E) Tlp11, (F) Tlp12, (G) Tlp13, (H) Tlp14, (I) LPi34-12.
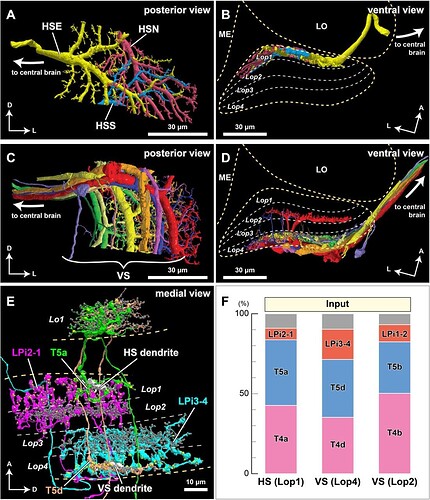
Synaptic connections of the horizontal system (HS) and vertical system (VS) lobula plate tangential cells.
(A, B) The three HS cells (HSN, HSE, and HSS) occupy Lop1, the fist layer of the lobula plate. Collectively the dendrites of these neurons span Lop1 and overlap in the region of the lobula plate within our data volume, but are cut off at the edges of the volume. (A) posterior view, (B) ventral view. (C, D) The ten identified VS cells in our data volume. All have postsynaptic terminals in Lop4, while four of them also have branches in Lop2. (C) posterior view, (D) ventral view. (E) Examples of major input neurons to the HS and VS cells in the lobula plate. Single dendritic arbors (length ~20 μm) of one HS cell and one VS cell are shown in white. HS dendrites primarily receive input from the T4a, T5a, and LPi2-1 cells in Lop1, whereas VS dendrites in Lop4 primarily receive input from the T4d, T5d, and LPi3-4 cells. The T4 terminals are not shown to minimize clutter. Yellow and gray dots represent pre- and postsynaptic sites, respectively. (F) Inputs to the HS and VS cells. Synapses are verified and counted for small pieces of the HS and VS arbors in the respective layers (two branches for each of HS and VS (Lop4) and one branch for VS (Lop2)). Almost 90% of the inputs to the HS and VS cell dendrites come from T4, T5, and the bilayer LPi cells. A similar input distribution is found for the VS cells’ branches in the Lop2 layer, where they receive inputs from the T4b, T5b, and LPi1-2 cells. Gray indicates other, more weakly connected neurons or unidentified neuron fragments, less than 10% of the total synapses (detailed in File S2). No output synapses were found on these branches. The scale bars are approximate as the neurons are three-dimensionally reconstructed.
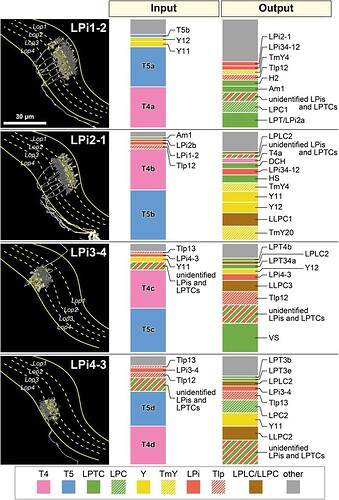
Connectivity of the bilayer Lobula Plate intrinsic (LPi) cells.
Keyword: LPi2-1, LPi3-4, Lpi1-2, LPi4-3
A representative cell of each neuron type is shown in the left panel. Presynaptic sites are indicated with yellow dots and postsynaptic sites are shown with gray dots. These neurons primarily integrate inputs in one layer and supply outputs to the adjacent layer. Only the LPi3-4 cell is completely reconstructed, while the other cells are only partially reconstructed, since single neurons cover larger LOP areas than the imaged data volume. A candidate light microscopy match for LPi1-2 (Figure S1) suggests the possibility that the LPi1-2 reconstructions (and perhaps also the similar LPi1-2 fragments) may be parts of one or a few large cells. In the right two panels, ratios of the input and output synapses are shown for each indicated cell type. These data are based on a single selected branch for each cell type (with 600-1000 postsynaptic sites, 100-170 presynaptic sites), for which the pre- and postsynaptic connected neurons were identified wherever possible. Cell types occupying less than 2% of the total input or output synapses are not shown and are included as “other”. A number of tangential elements that have synapses with the LPi cells were only partially reconstructed due to the restricted data volume. These fragments of considerable size are grouped as “unidentified LPis and LPTCs”. Data summary based on File S3.
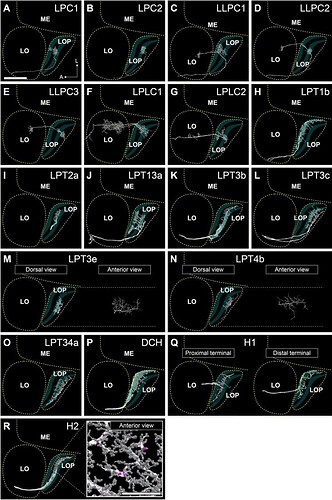
Lobula plate Visual Projection Neurons (VPNs) that integrate T4 and T5 inputs.
Keywords: LPC1, LPC2, LLPC1, LLPC2, LLPC3, LPLC1, LPLC2, LPT1b, LPT2a, LPT13a, LPT3b, LPT3c, LPT3e, LPT4b, LPT34a, DCH, H1, H2, lobula plate, lobula plate tangental, lobula plate columnar
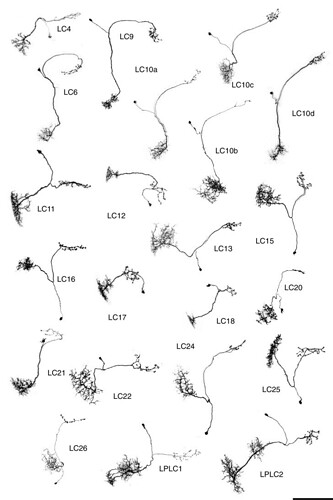
The neurons are seen from the dorsal direction (horizontal projection), the approximate neuropil boundaries are outlined, and the LOP layers are indicated. Only neurons mentioned in other figures or in the main text are shown here. Some neurons are not fully reconstructed, especially the cell body fibers and the main axons projecting to the central brain. Lobula plate-lobula columnar (LPLC) cells have cell bodies in the cell body rind between the optic lobe and central brain and dendritic arbors in the lobula that extend into the lobula plate38,40, and project to the central brain from the lobula. Lobula plate columnar (LPC) and lobula-lobula plate columnar (LLPC) cells have cell bodies in the cell body rind of the lobula plate38,40,41,43,44, and project axons along a path posterior to the lobula plate to glomeruli in the posterior lateral protocerebrum. Both LPC and LLPC send a branch into the lobula plate which, in the case of LLPC cells, further extends into the lobula. HS and VS cells are omitted from this figure (see Figure 3). In (R), the branching pattern and synapse distribution is shown in the inset. Pre- and postsynapses are shown in magenta and gray, respectively. In (A), A: anterior, L: lateral. Scale bar: (A-S) 30μm, (R) inset 20μm.
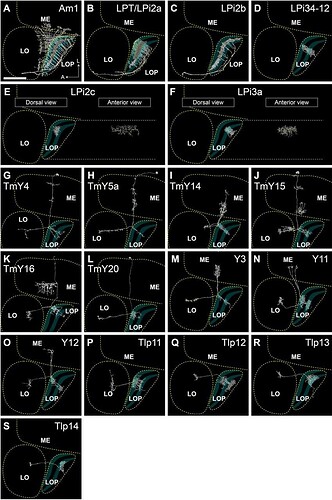
Optic lobe intrinsic neurons that integrate T4 and T5 inputs.
Keywords: Am1, LPT, LPi2a, LPi2b, LPi34-12, LPi2c, LPi3a, Lobula Plate Intrinsic, TmY4, TmY5a, TmY14, TmY15, TmY16, TmY20, Transmedullary Y, Y3, Y11, Y12, Tlp11, Tlp12, Tlp13, Tlp14
The neurons are seen from the dorsal direction (horizontal projection), the approximate neuropil boundaries are outlined, and the LOP layers are indicated. Only neurons mentioned in other figures or in the main text are shown here. Some of the neurons are not fully reconstructed, especially the cell body fibers. We confirmed the general cell shapes of all newly identified cell types shown in this figure (with the exception of the comparatively small LPi2c and LPi3a fragments) by comparison to light microscopy images (Figures S1 and S2). Based on these matches, LPT/LPi2a may be a type of VPN with a central brain projection. Pre- and postsynapses are shown in magenta and gray, respectively. Scale bar: 30μm.
Source:
Neuronal circuits integrating visual motion information in Drosophila
Kazunori Shinomiya, Aljoscha Nern, Ian A. Meinertzhagen, Stephen M. Plaza, Michael B. Reiser
bioRxiv 2021.12.20.473513; doi: https://doi.org/10.1101/2021.12.20.473513
